Cloud Data Warehouse vs Traditional Data Warehouse Concepts
Cloud-based data warehouses are the new norm. Gone are the days where your business had to purchase hardware, create server rooms and hire, train, and maintain a dedicated team of staff to run it. Now, with a few clicks on your laptop and a credit card, you can access practically unlimited computing power and storage space.
However, this does not mean that traditional data warehouse ideas are dead. Classical data warehouse theory underpins most of what cloud-based data warehouses do.
In this article, we’ll explain the traditional data warehouse concepts you need to know and the most important cloud ones from a selection of the top providers: Amazon, Google, and Panoply. Finally, we’ll wrap up with a cost-benefit analysis of traditional vs. cloud data warehouses, so you know which one is right for you.
Let’s get started.
Traditional Data Warehouse Concepts
A data warehouse is any system that collates data from a wide range of sources within an organization. Data warehouses are used as centralized data repositories for analytical and reporting purposes.
A traditional data warehouse is located on-site at your offices. You purchase the hardware, the server rooms and hire the staff to run it. They are also called on-premises, on-prem or (grammatically incorrect) on-premise data warehouses.
Facts, Dimensions, and Measures
The core building blocks of information in a data warehouse are facts, dimensions, and measures.
A fact is the part of your data that indicates a specific occurrence or transaction. For example, if your business sells flowers, some facts you would see in your data warehouse are:
- Sold 30 roses in-store for $19.99
- Ordered 500 new flower pots from China for $1500
- Paid salary of cashier for this month $1000
Several numbers can describe each fact, and we call these numbers measures. Some measures to describe the fact ‘ordered 500 new flower pots from China for $1500’ are:
- Quantity ordered - 500
- Cost - $1500
When analysts are working with data, they perform calculations on measures (e.g., sum, maximum, average) to glean insights. For example, you may want to know the average number of flower pots you order each month.
A dimension categorizes facts and measures and provides structured labeling information for them - otherwise, they would just be a collection of unordered numbers! Some dimensions to describe the fact ‘ordered 500 new flower pots from China for $1500’ are:
- Country purchased from - China
- Time purchased - 1 pm
- Expected date of arrival - June 6th
You cannot perform calculations on dimensions explicitly, and doing so probably would not be very helpful - how can you find the ‘average arrival date for orders’? However, it is possible to create new measures from dimensions, and these are useful. For example, if you know the average number of days between the order date and arrival date, you can better plan stock purchases.
Normalization and Denormalization
Normalization is the process of efficiently organizing data in a data warehouse (or any other place that stores data). The main goals are to reduce data redundancy - i.e., remove any duplicate data - and improve data integrity - i.e., improve the accuracy of data. There are different levels of normalization and no consensus for the ‘best’ method. However, all methods involve storing separate but related pieces of information in different tables.
There are many benefits to normalization, such as:
- Faster searching and sorting on each table
- Simpler tables make data modification commands faster to write and execute
- Less redundant data means you save on disk space, and so you can collect and store more data
Denormalization is the process of deliberately adding redundant copies or groups of data to already normalized data. It is not the same as un-normalized data. Denormalization improves the read performance and makes it much easier to manipulate tables into forms you want. When analysts work with data warehouses, they typically only perform reads on the data. Thus, denormalized data can save them vast amounts of time and headaches.
Benefits of denormalization:
- Fewer tables minimize the need for table joins which speeds up data analysts’ workflow and leads them discovering more useful insights in the data
- Fewer tables simplify queries leading to fewer bugs
Data Models
It would be wildly inefficient to store all your data in one massive table. So, your data warehouse contains many tables that you can join together to get specific information. The main table is called a fact table, and dimension tables surround it.
The first step in designing a data warehouse is to build a conceptual data model that defines the data you want and the high-level relationships between them.
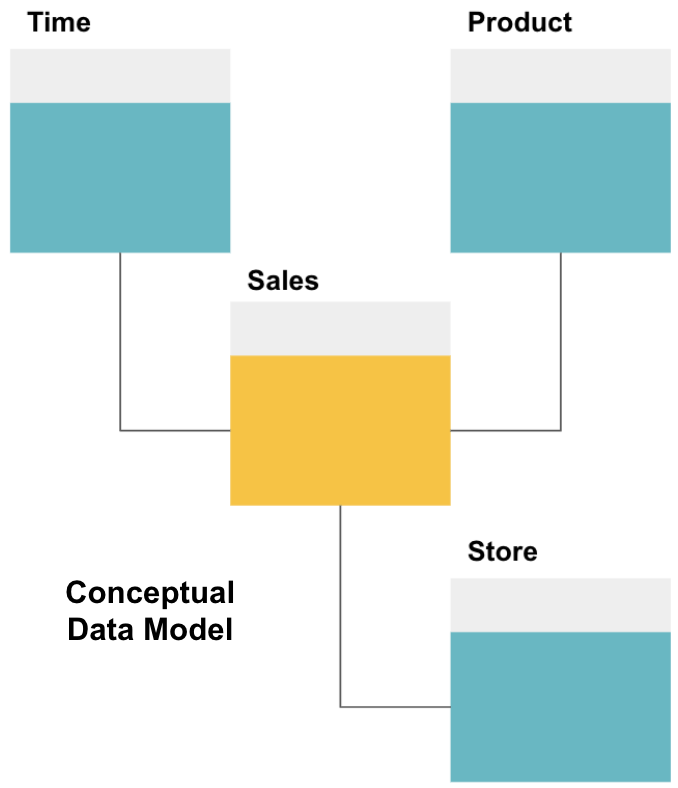
Here, we have defined the conceptual model. We are storing Sales data and have three additional tables - Time, Product, and Store - that provide extra, more granular information about each sale. The fact table is Sales, and the others are dimension tables.
The next step is to define a logical data model. This model describes the data in detail in plain English without worrying about how to implement it in code.
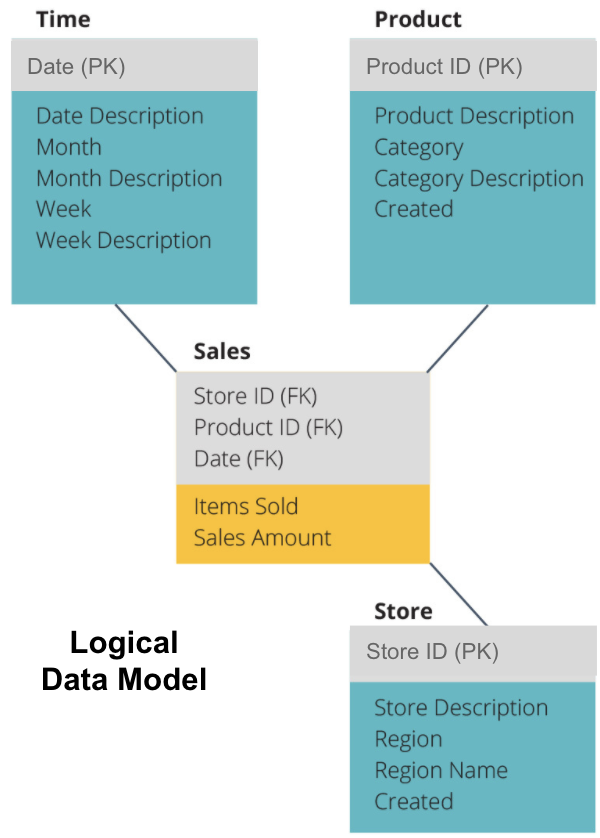
Now we have filled out which information each table contains in plain English. Each of the Time, Product, and Store dimension tables shows the Primary Key (PK) in the grey box and the corresponding data in the blue boxes. The Sales table contains three Foreign Keys (FK) so that it can quickly join with the other tables.
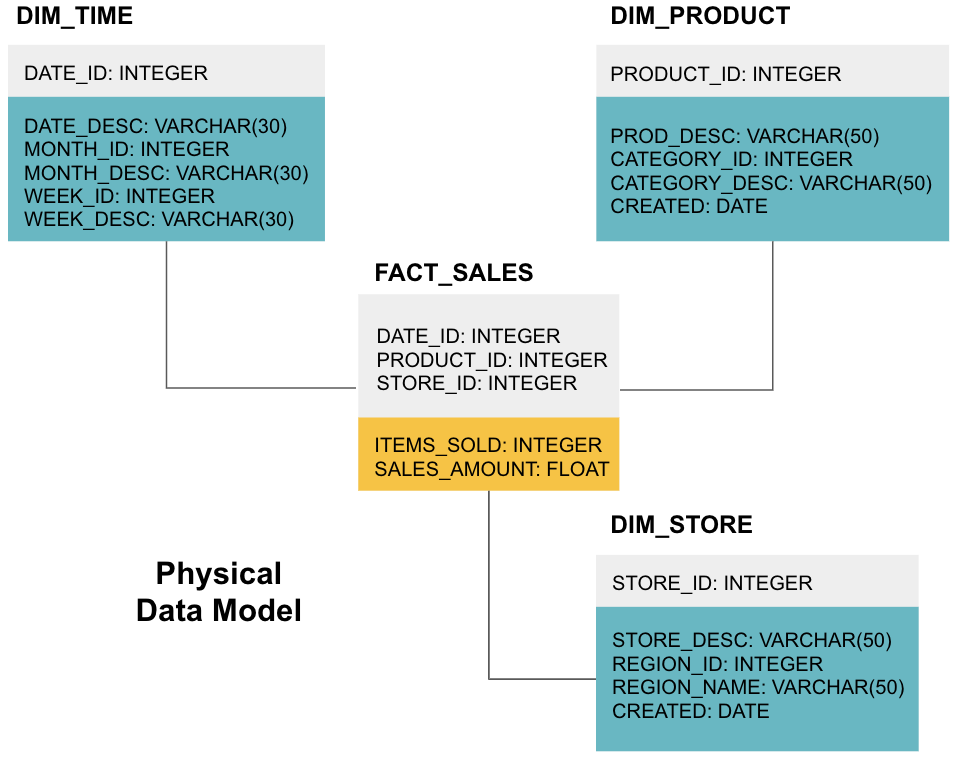
The final stage is to create a physical data model. This model tells you how to implement the data warehouse in code. It defines tables, their structure, and the relationship between them. It also specifies data types for columns, and everything is named as it will be in the final data warehouse, i.e., all caps and connected with underscores. Lastly, each dimension table starts with DIM_, and each fact table starts with FACT_.
Now you know how to design a data warehouse, but there are a few nuances to fact and dimension tables that we’ll explain next.
Fact Table
Each business function - e.g., sales, marketing, finance - has a corresponding fact table.
Fact tables have two types of columns: dimension columns and fact columns. Dimension columns - colored grey in our examples - contain Foreign Keys (FK) that you use to join a fact table with a dimension table. These foreign keys are the Primary Keys (PK) for each of the dimension tables. Fact columns - colored yellow in our examples - contain the actual data and measures to be analyzed, e.g., the number of items sold and the total dollar value of sales.
A factless fact table is a particular type of fact table that only has dimension columns. Such tables are useful for tracking events, such as student attendance or employee leave, as the dimensions tell you everything you need to know about the events.
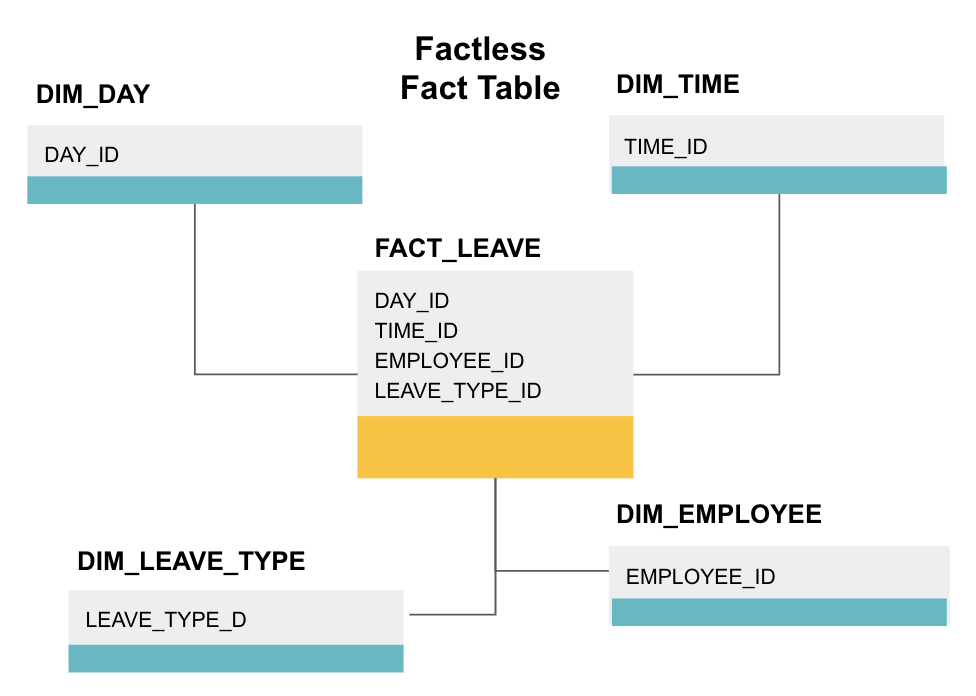
The above factless fact table tracks employee leave. There are no facts since you just need to know:
- What day they were off (DAY_ID).
- How long they were off (TIME_ID).
- Who was on leave (EMPLOYEE_ID).
- Their reason for being on leave, e.g., illness, holiday, doctor’s appointment, etc. (LEAVE_TYPE_ID).
Star Schema vs. Snowflake Schema
The above data warehouses have all had a similar layout. However, this is not the only way to arrange them.
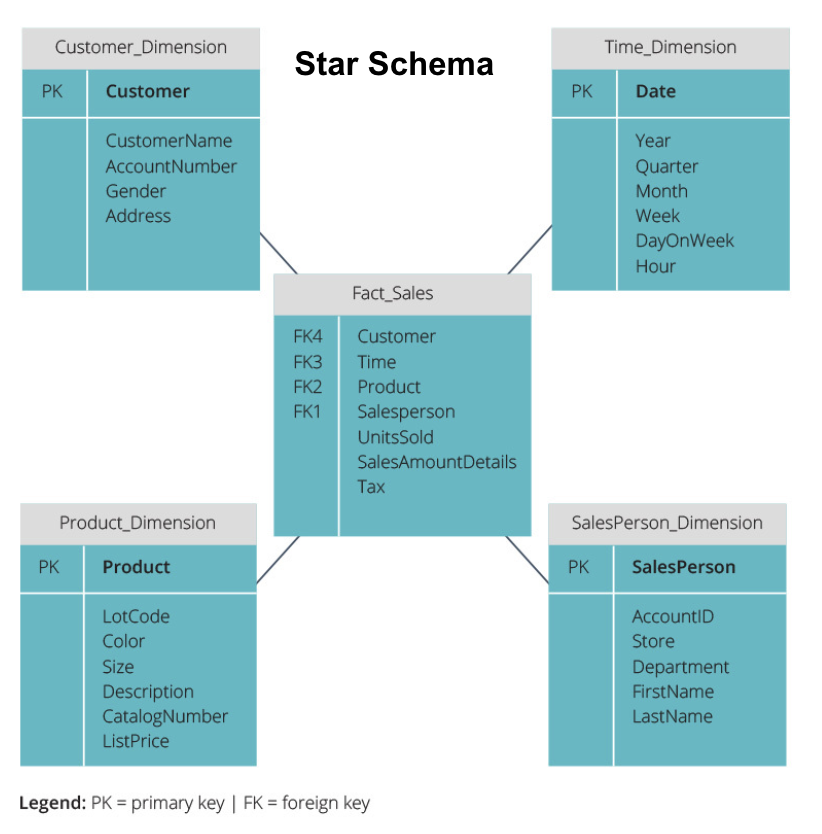
The two most common schemas used to organize data warehouses are star and snowflake. Both methods use dimension tables that describe the information contained within a fact table.
The star schema takes the information from the fact table and splits it into denormalized dimension tables. The emphasis for the star schema is on query speed. Only one join is needed to link fact tables to each dimension, so querying each table is easy. However, since the tables are denormalized, they often contain repeated and redundant data.
The snowflake schema splits the fact table into a series of normalized dimension tables. Normalizing creates more dimension tables, and so reduces data integrity issues. However, querying is more challenging using the snowflake schema because you need more table joins to access the relevant data. So, you have less redundant data, but it is harder to access.

Now we’ll explain some more fundamental data warehouse concepts.
OLAP vs. OLTP
Online transaction processing (OLTP) is characterized by short write transactions that involve the front-end applications of an enterprise’s data architecture. OLTP databases emphasize fast query processing and only deal with current data. Businesses use these to capture information for business processes and provide source data for the data warehouse.
Online analytical processing (OLAP) allows you to run complex read queries and thus perform a detailed analysis of historical transactional data. OLAP systems help to analyze the data in the data warehouse.
Three Tier Architecture
Traditional data warehouses are typically structured in three tiers:
- Bottom Tier: A database server, typically an RDBMS, that extracts data from different sources using a gateway. Data sources fed into this tier include operational databases and other types of front-end data such as CSV and JSON files.
- Middle Tier: An OLAP server that either
- Directly implements the operations, or
- Maps the operations on multidimensional data to standard relational operations, e.g., flattening XML or JSON data into rows within tables.
- Top Tier: The querying and reporting tools for data analysis and business intelligence.
Virtual Data Warehouse / Data Mart
Virtual data warehousing uses distributed queries on several databases, without integrating the data into one physical data warehouse.
Data marts are subsets of data warehouses oriented for specific business functions, such as sales or finance. A data warehouse typically combines information from several data marts in multiple business functions. Yet, a data mart contains data from a set of source systems for one business function.
Kimball vs. Inmon
There are two approaches to data warehouse design, proposed by Bill Inmon and Ralph Kimball. Bill Inmon is an American computer scientist who is recognized as the father of the data warehouse. Ralph Kimball is one of the original architects of data warehousing and has written several books on the topic.
The two experts had conflicting opinions on how data warehouses should be structured. This conflict has given rise to two schools of thought.
The Inmon approach is a top-down design. With the Inmon methodology, the data warehouse is created first and is seen as the central component of the analytic environment. Data is then summarized and distributed from the centralized warehouse to one or more dependent data marts.
The Kimball approach takes a bottom-up view of data warehouse design. In this architecture, an organization creates separate data marts, which provide views into single departments within an organization. The data warehouse is the combination of these data marts.
ETL vs. ELT
Extract, Transform, Load (ETL) describes the process of extracting the data from source systems (typically transactional systems), converting the data to a format or structure suitable for querying and analysis, and finally loading it into the data warehouse. ETL leverages a separate staging database and applies a series of rules or functions to the extracted data before loading.
Extract, Load, Transform (ELT) is a different approach to loading data. ELT takes the data from disparate sources and loads it directly into the target system, such as the data warehouse. The system then transforms the loaded data on-demand to enable analysis.
ELT offers quicker loading than ETL, but it requires a powerful system to perform the data transformations on-demand.
Enterprise Data Warehouse
An enterprise data warehouse is intended as a unified, centralized warehouse containing all transactional information in the organization, both current and historical. An enterprise data warehouse should incorporate data from all subject areas related to the business, such as marketing, sales, finance, and human resources.
These are the core ideas that make up traditional data warehouses. Now, let’s look at what cloud data warehouses have added on top of them.
Cloud Data Warehouse Concepts
Cloud data warehouses are new and constantly changing. To best understand their fundamental concepts, it is best to learn about the leading cloud data warehouse solutions.
Three leading cloud data warehouse solutions are Amazon Redshift, Google BigQuery, and Panoply. Below, we explain fundamental concepts from each of these services to provide you with a general understanding of how modern data warehouses work.
Cloud Data Warehouse Concepts - Amazon Redshift
The following concepts are explicitly used in the Amazon Redshift cloud data warehouse but may apply to additional data warehouse solutions in the future based on Amazon infrastructure.
Clusters
Amazon Redshift bases its architecture on clusters. A cluster is simply a group of shared computing resources, called nodes.
Nodes
Nodes are computing resources that have CPU, RAM, and hard disk space. A cluster containing two or more nodes is composed of a leader node and compute nodes.
Leader nodes communicate with client programs and compile code to execute queries, assigning it to compute nodes. Compute nodes run the queries and return the results to the leader node. A compute node only executes queries that reference tables stored on that node.
Partitions/Slices
Amazon partitions each compute node into slices. A slice receives an allocation of memory and disk space on the node. Multiple slices operate in parallel to speed up query execution time.
Columnar Storage
Redshift uses columnar storage, enabling better analytic query performance. Instead of storing records in rows, it stores values from a single column for multiple rows. The following diagrams make this clearer:
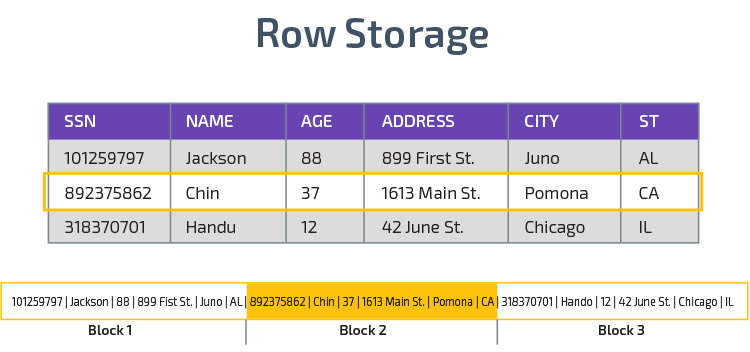
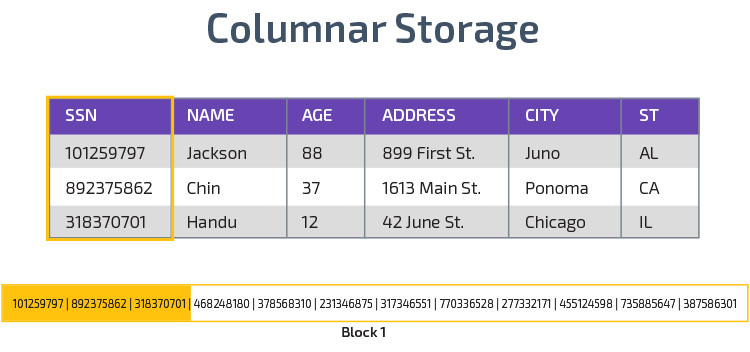
Columnar storage makes it possible to read data faster, which is crucial for analytical queries that span many columns in a data set. Columnar storage also takes up less disk space, because each block contains the same type of data, meaning it can be compressed into a specific format.
Compression
Compression reduces the size of the stored data. In Redshift, because of the way data is stored, compression occurs at the column level. Redshift allows you to compress information manually when creating a table, or automatically using the COPY command.
Data Loading
You can use Redshift’s COPY command to load large amounts of data into the data warehouse. The COPY command leverages Redshift’s MPP architecture to read and load data in parallel from files on Amazon S3, from a DynamoDB table, or text output from one or more remote hosts.
It is also possible to stream data into Redshift, using the Amazon Kinesis Firehose service.
Cloud Database Warehouse - Google BigQuery
The following concepts are explicitly used in the Google BigQuery cloud data warehouse but may apply to additional solutions in the future based on Google infrastructure.
Serverless Service
BigQuery uses serverless architecture. With BigQuery, businesses don’t need to manage physical server units to run their data warehouses. Instead, BigQuery dynamically manages the allocation of its computing resources. Enterprises using the service simply pay for data storage per gigabyte and queries per terabyte.
Colossus File System
BigQuery uses the latest version of Google’s distributed file system, code-named Colossus. The Colossus file system uses columnar storage and compression algorithms to store data for analytical purposes optimally.
Dremel Execution Engine
The Dremel execution engine uses a columnar layout to query vast stores of data quickly. Dremel’s execution engine can run ad-hoc queries on billions of rows in seconds because it uses massively parallel processing in the form of a tree architecture.
The tree architecture distributes queries among several intermediate servers from a root server. The intermediate servers push the query down to leaf servers (containing stored data), which scan the data in parallel. On the way back up the tree, each leaf server sends query results, and the intermediate servers perform a parallel aggregation of partial results.
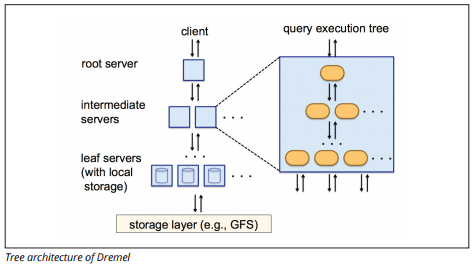
Dremel enables organizations to run queries on up to tens of thousands of servers simultaneously. According to Google, Dremel can scan 35 billion rows without an index in tens of seconds.
Data Sharing
Google BigQuery’s serverless architecture allows enterprises to easily share data with other organizations without requiring those organizations to invest in their own storage.
Organizations that want to query shared data can do so, and they’ll only pay for the queries. There is no need to create costly shared data silos, external to the organization’s data infrastructure, and copy the data to those silos.
Streaming and Batch Ingestion
It is possible to load data to BigQuery from Google Cloud Storage, including CSV, JSON (newline-delimited), and Avro files, as well as Google Cloud Datastore backups. You can also load data directly from a readable data source.
BigQuery also offers a Streaming API to load data into the system at a speed of millions of rows per second without performing a load. The data is available for analysis almost immediately.
Cloud Data Warehouse Concepts - Panoply
Panoply is an all-in-one warehouse that combines ETL with a powerful data warehouse. It is the easiest way to sync, store, and access a company’s data by eliminating the development and coding associated with transforming, integrating, and managing big data.
Below are some of the main concepts in the Panoply data warehouse related to data modeling and data protection.
Primary Keys
Primary keys ensure that all rows in your tables are unique. Each table has one or more primary keys that define what represents a single unique row in the database. All APIs have a default primary key for tables.
Incremental Keys
Panoply uses an incremental key to control attributes for incrementally loading data to the data warehouse from sources rather than reloading the entire dataset each time something changes. This feature is helpful for larger datasets, which can take a long time to read mostly unchanged data. The incremental key indicates the last update point for the rows in that data source.
Nested Data
Nested data is not fully compatible with BI suites and standard SQL queries—Panoply deals with nested data by using a strongly relational model that doesn’t permit nested values. Panoply transforms nested data in these ways:
- Subtables: By default, Panoply transforms nested data into a set of many-to-many or one-to-many relationship tables, which are flat relational tables.
- Flattening: With this mode enabled, Panoply flattens the nested structure onto the record that contains it.
History Tables
Sometimes you need to analyze data by keeping track of changing data over time to see exactly how the data changes (for example, people’s addresses).
To perform such analyses, Panoply uses History Tables, which are time-series tables that contain historical snapshots of every row in the original static table. You can then perform straightforward querying of the original table or revisions to the table by rewinding to any point in time.
Transformations
Panoply uses ELT, which is a variation on the original ETL data integration process. Once you have injected data from the source into your data warehouse, Panoply immediately transforms it. This process gives you real-time data analysis and optimal performance when compared to the standard ETL process.
String Formats
Panoply parses string formats and handles them as if they were nested objects in the original data. Supported string formats are CSV, TSV, JSON, JSON-Line, Ruby object format, URL query strings, and web distribution logs.
Data Protection
Panoply follows best practices in keeping your data secure, including built-in encryption and regular testing.
Extra protection comes from columnar encryption, which lets you use your private keys that are not stored on Panoply’s servers.
Access Control
Panoply uses two-step verification to prevent unauthorized access, and a permission system lets you restrict access to specific tables, views, or columns.
IP Whitelisting
We recommend you block connections from unrecognized sources by using a firewall and whitelist the range of IP addresses that Panoply’s data sources always use when accessing your database.
Conclusion: Traditional vs. Data Warehouse Concepts in Brief
To wrap up, we’ll summarize the concepts introduced in this document.
Traditional Data Warehouse Concepts
- Facts and measures: a measure is a property on which calculations can be made. We refer to a collection of measures as facts, but sometimes the terms are used interchangeably.
- Normalization: the process of reducing the amount of duplicate data, which leads to a more memory efficient data warehouse that is slower to query.
- Dimension: Used to categorize and contextualize facts and measures, enabling analysis of and reporting on those measures.
- Conceptual data model: Defines the critical high-level data entities and the relationships between them.
- Logical data model: Describes data relationships, entities, and attributes in plain English without worrying about how to implement it in code.
- Physical data model: A representation of how to implement the data design in a specific database management system.
- Star schema: Takes a fact table and splits its information into denormalized dimension tables.
- Snowflake schema: Splits the fact table into normalized dimension tables. Normalizing reduces data redundancy issues and improves data integrity, but queries are more complex.
- OLTP: Online transaction processing systems facilitate fast, transaction-oriented processing with simple queries.
- OLAP: Online analytical processing allows you to run complex read queries and thus perform a detailed analysis of historical transactional data.
- Data mart: an archive of data focusing on a specific subject or department within an organization.
- Inmon approach: Bill Inmon’s data warehouse approach defines the data warehouse as the centralized data repository for the entire enterprise. Data marts can be built from the data warehouse to serve the analytic needs of different departments.
- Kimball approach: Ralph Kimball describes a data warehouse as the merging of mission-critical data marts, which are first created to serve the analytic needs of different departments.
- ETL: Integrates data into the data warehouse by extracting it from various transactional sources, transforming the data to optimize it for analysis, and finally loading it into the data warehouse.
- ELT: A variation on ETL that extracts raw data from an organization’s data sources and loads it into the data warehouse. When needed, it’s transformed for analytical purposes.
- Enterprise Data Warehouse: The EDW consolidates data from all subject areas related to the enterprise.
Cloud Data Warehouse Concepts - Amazon Redshift as Example
- Cluster: A group of shared computing resources based in the cloud.
- Node: A computing resource contained within a cluster. Each node has its own CPU, RAM, and hard disk space.
- Columnar storage: This stores the values of a table in columns rather than rows, which optimizes the data for aggregated queries.
- Compression: Techniques to reduce the size of stored data.
- Data loading: Getting data from sources into the cloud-based data warehouse. In Redshift, you can use the COPY command or a data streaming service.
Cloud Data Warehouse Concepts - BigQuery as Example
- Serverless service: The cloud provider dynamically manages the allocation of machine resources based on the amount the user consumes. The cloud provider hides server management and capacity planning decisions from the users of the service.
- Colossus file system: A distributed file system that uses columnar storage and data compression algorithms to optimize data for analysis.
- Dremel execution engine: A query engine that uses massively parallel processing and columnar storage to execute queries quickly.
- Data sharing: In a serverless service, it is practical to query another organization’s shared data without investing in data storage—you simply pay for the queries.
- Streaming data: Inserting data in real-time into the data warehouse without performing a load. You can stream data in batch requests, which are multiple API calls combined into one HTTP request.
Traditional vs. Cloud Cost-Benefit Analysis
| Cost/Benefit | Traditional | Cloud |
| Cost | Large upfront cost to purchase and install an on-prem system. You need hardware, server rooms, and specialist personnel (that you pay on an on-going basis). If you are unsure how much storage space you need, there is a risk of high sunk costs that are hard to recover. |
No need to purchase hardware, server rooms, or hire specialists. No risk of sunk costs - buying more storage in the future is easy. Plus, the cost of storage and computing power are decreasing over time. |
| Scalability | Once you max out your current server rooms or hardware capacity, you may have to purchase new hardware and build/buy more places to house it. Plus, you need to buy enough storage to cope with peak times; thus, most of the time, most of your storage isn’t used. |
You can easily buy more storage as and when you need it. Often just have to pay for what you use, so there is little to no risk of overpaying. |
| Integrations | As cloud computing is the norm, most integrations you want to make will be to cloud services. Connecting your custom data warehouse to them can prove challenging. |
As cloud data warehouses are already in the cloud, connecting to a range of other cloud services is simple. |
| Security | You have total control of your data warehouse. Comparing the amount of data you house to Amazon or Google, you are a smaller target for thieves. So, you may be more likely to be left alone. |
Cloud data warehouse providers have teams full of highly skilled security engineers whose sole purpose is to make their product as secure as possible. The most prominent companies in the world manage them and therefore implement world-class security practices. |
| Governance | You know exactly where your data is and can access it locally. Less risk of highly sensitive data inadvertently breaking the law by, for example, traveling across the world on a cloud server. |
The top cloud data warehouse providers ensure they are compliant with governance and security laws, such as GDPR. Plus, they help your business ensure you are compliant. There have been issues regarding knowing exactly your data is and where it moves. These problems are actively being addressed and solved. Note that storing vast amounts of highly sensitive data on the cloud may be against specific laws. This is one instance where cloud computing may be inappropriate for your business. |
| Reliability | If your on-prem data warehouse fails, it is your responsibility to fix it. Your IT team has access to the physical hardware and can access every software layer to troubleshoot. This quick access can make solving problems much faster. However, there is no guarantee that your warehouse will have a particular amount of uptime each year. |
Cloud data warehouse providers guarantee their reliability and uptime in their SLAs. They operate on massively distributed systems throughout the world, so if there is a failure on one, it is highly unlikely to affect you. |
| Control | Your data warehouse is custom built to suit your needs. In theory, it does what you want it to do, when you want it to, in a way you understand. | You do not have total control over your data warehouse. However, the majority of the time, the control you have is more than enough. |
| Speed | If you are a small company in one geographic location with a small amount of data, your data processing will be faster. However, we are talking milliseconds vs. seconds for some processes to complete. A large company operating in multiple countries is unlikely to see significant speed gains with an on-prem system. |
Cloud providers have invested in and created systems that implement Massively Parallel Processing (MPP), custom-built architecture and execution engines, and intelligent data processing algorithms. Cloud data warehouses are the result of years of research and testing to create resources optimized for speed and performance. It may be slightly slower than on-prem in some cases, but these delays are often negligible for humans (seconds vs. milliseconds). |
Panoply is a secure place to store, sync, and access all your business data. Panoply can be set up in minutes, requires minimal on-going maintenance, and provides online support, including access to experienced data architects. Free 21-Day Proof of Value.