A data mart focuses on a particular subject, business process, or department. A data warehouse integrates data for broader reporting across an organization. The main difference is their scope.
You can use both together. A warehouse might bring orders and inventory into a shared environment, while a sales mart gives analysts a simpler set of tables for their daily reporting. The mart can live inside that same environment.
Choosing an approach starts with how much integration your reporting needs, who will maintain it, and how people will access the results.
Data mart vs. data warehouse: the main differences
A warehouse supports a broader analytical picture; a mart narrows the data to a specific purpose. Their names do not prescribe a particular database engine, storage capacity, or budget.
| Comparison | Data mart | Data warehouse |
|---|---|---|
| Main purpose | Support a defined subject, process, or team | Integrate data for broader analysis |
| Typical users | Analysts and business users with related reporting needs | Teams working across multiple business areas |
| Data sources | A warehouse, source systems, or both | Sources selected for the organization’s analytical needs |
| Level of detail | Detailed records, aggregates, or both | Detailed records, aggregates, or both |
| Modeling | Tailored to the questions being answered | Designed to connect data across subjects and processes |
| Implementation | Can be curated tables or views within an existing platform | Provides the broader integration and analytical environment |
| Governance | Needs clear ownership and alignment with shared definitions | Needs coordination across contributing systems and teams |
| Cost drivers | Data preparation, storage, queries, refreshes, and maintenance | The same drivers applied to a broader set of workloads |
For example, a large sales dataset can still be a mart if its purpose is narrowly defined. A smaller warehouse can integrate several business functions. Storage size alone does not tell you which role a dataset serves.
Likewise, a mart is not automatically faster. Performance depends on its design and the work a query must do. A carefully prepared reporting table may help; a view that repeats expensive joins may not.
The 3 types of data marts
The relationship to source data determines whether a mart is dependent, independent, or hybrid. These data mart types describe where the data comes from. Physical storage is a separate design choice.
Dependent data mart
A dependent mart receives its data from a central warehouse. It gives users a focused version of data that has already passed through the warehouse’s integration process.
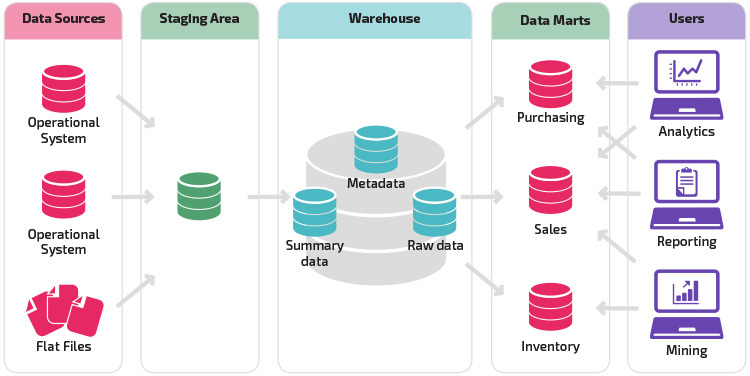
A dependent mart draws from the warehouse. This diagram illustrates that arrangement; independent marts follow a different path.
This is a useful starting point when you already have reliable warehouse data but users need simpler access. The mart still inherits upstream problems, including missing records or delayed source updates.
Independent data mart
An independent mart receives data directly from source systems without requiring a central warehouse. A team could use one for a focused reporting need before a wider data program exists.
The tradeoff appears as more teams build their own versions. If each defines customers or revenue differently, combining their reports becomes harder.
Hybrid data mart
A hybrid mart combines warehouse data with other sources. For example, a marketing team could join established customer records to a new campaign dataset.
That flexibility needs ownership. Decide who validates the additional source and whether its transformations should eventually become part of the shared warehouse.
Example: a warehouse and marts for an online store
Imagine an online retailer that needs to understand campaign performance and profitability. This illustrative business uses a warehouse to bring together orders, advertising spend, inventory, and refunds.
It then creates focused reporting datasets:
- Marketing mart: campaign spend, attributed orders, and customer acquisition measures.
- Finance mart: sales, refunds, product costs, and margin calculations.
- Inventory mart: stock levels, product movements, and replenishment measures.
These datasets overlap. Marketing and finance both need orders, but they ask different questions about them. Shared customer identifiers and counting rules help both teams recognize the same person consistently.
Grain means what one row represents. An order-line table might contain one row per product line within an order. A daily campaign table might contain one row per campaign per day. Both are useful, but they are not interchangeable.
Suppose you join daily campaign spend directly to every order line and then sum it. You could count the same advertising spend repeatedly. Choose compatible levels of detail or aggregate each side appropriately before combining the results.
The grain of a fact table is a modeling decision, not a rule that marts must contain summaries. Keep the detail needed for investigation, and create separate aggregates where they help recurring reports.
The same care applies to revenue. Finance might report sales after refunds, while marketing reports attributed sales before refunds. Give those measures distinct names and documented formulas. Shared storage cannot resolve a disagreement that nobody has defined.
How data marts work in a cloud warehouse
A mart can be a curated collection of tables and views inside your existing cloud platform. For example, Amazon Redshift supports both warehouses and marts, so one platform can serve both roles.
You have several implementation choices:
| Option | What it contains | Main tradeoff |
|---|---|---|
| Logical views | Saved queries that present selected data | Avoid storing another result set, but queries still require processing |
| Stored tables | Results written by transformation jobs | Allow prepared reporting structures, but require storage and update jobs |
| Materialized views | Stored query results maintained through database features | Can reduce repeated work, but introduce refresh costs and engine-specific limits |
A logical view is useful when you want business-friendly columns and reusable query logic. It does not automatically make an expensive query cheap. The underlying joins and calculations still matter.
With stored tables, you control the transformation schedule. A daily refresh may suit yesterday’s sales report but fail a requirement to monitor today’s orders. Choose the schedule from the reporting need, then make freshness visible to users.
Materialized views offer another option for recurring workloads. In BigQuery’s view model, logical views store query definitions while materialized views physically retain computed data. Refresh and freshness behavior depend on the engine and configuration, so do not assume every stored view behaves identically.
Start with the simplest implementation that meets the workload. Add physical copies or precomputation when a measured performance or availability requirement justifies their maintenance. If users need isolated computing resources, check how your platform allocates compute; another table alone does not provide that isolation.
What changes the cost and governance workload?
Budget for the work, not the label. A narrow mart can reduce the scope of an initial project, but duplicating transformations across several marts can create ongoing costs.
Estimate these separately:
- Ingestion: moving source data and handling updates.
- Transformation: cleaning records, joining sources, and calculating metrics.
- Storage: retained history and additional physical copies.
- Query compute: dashboard activity and exploratory analysis.
- Maintenance: refreshes, failures, access reviews, and changing source schemas.
BigQuery pricing separates storage from compute and includes method-dependent ingestion and transfer charges. Its materialized views can incur query, maintenance, and storage costs. A view with no extra result storage can still generate substantial query costs; a stored result can save repeated compute while adding refresh work. Compare the total cost at the required reporting frequency.
Provisioning a cloud database is only one part of implementation. Connecting sources, reconciling identifiers, agreeing on metrics, and validating reports determine when people can rely on the data. A mart built on clean warehouse tables may need less preparation than an independent mart that must resolve conflicting source records. Set delivery milestones around validated reporting, with time for access controls and refresh monitoring.
Governance also needs a concrete plan. Assign an owner to each mart, document its source tables and metric definitions, and specify which users may access sensitive fields.
For the retailer, that means agreeing on customer identifiers and the treatment of refunds. It also means deciding who fixes a failed finance refresh. A centrally hosted dataset still needs someone responsible for its accuracy and availability.
Where Inmon and Kimball fit
Inmon and Kimball describe influential approaches to organizing warehouse architecture. They provide context, but neither turns today’s decision into a mandatory choice between a warehouse and marts.
Inmon’s approach is commonly represented as a central integrated warehouse feeding downstream marts. Its emphasis is on establishing the broader integration layer.
Kimball’s approach delivers dimensional models around business processes, connecting them through conformed dimensions. These are shared dimensions, such as customers and products, whose definitions remain consistent across models.
The Kimball bus architecture plans that integration from the start. Building unrelated marts and hoping to combine them later misses this requirement.
Dimensional modeling also works in an Inmon-style delivery layer. The historical approaches differ, but a star schema alone does not tell you which overall architecture a company follows.
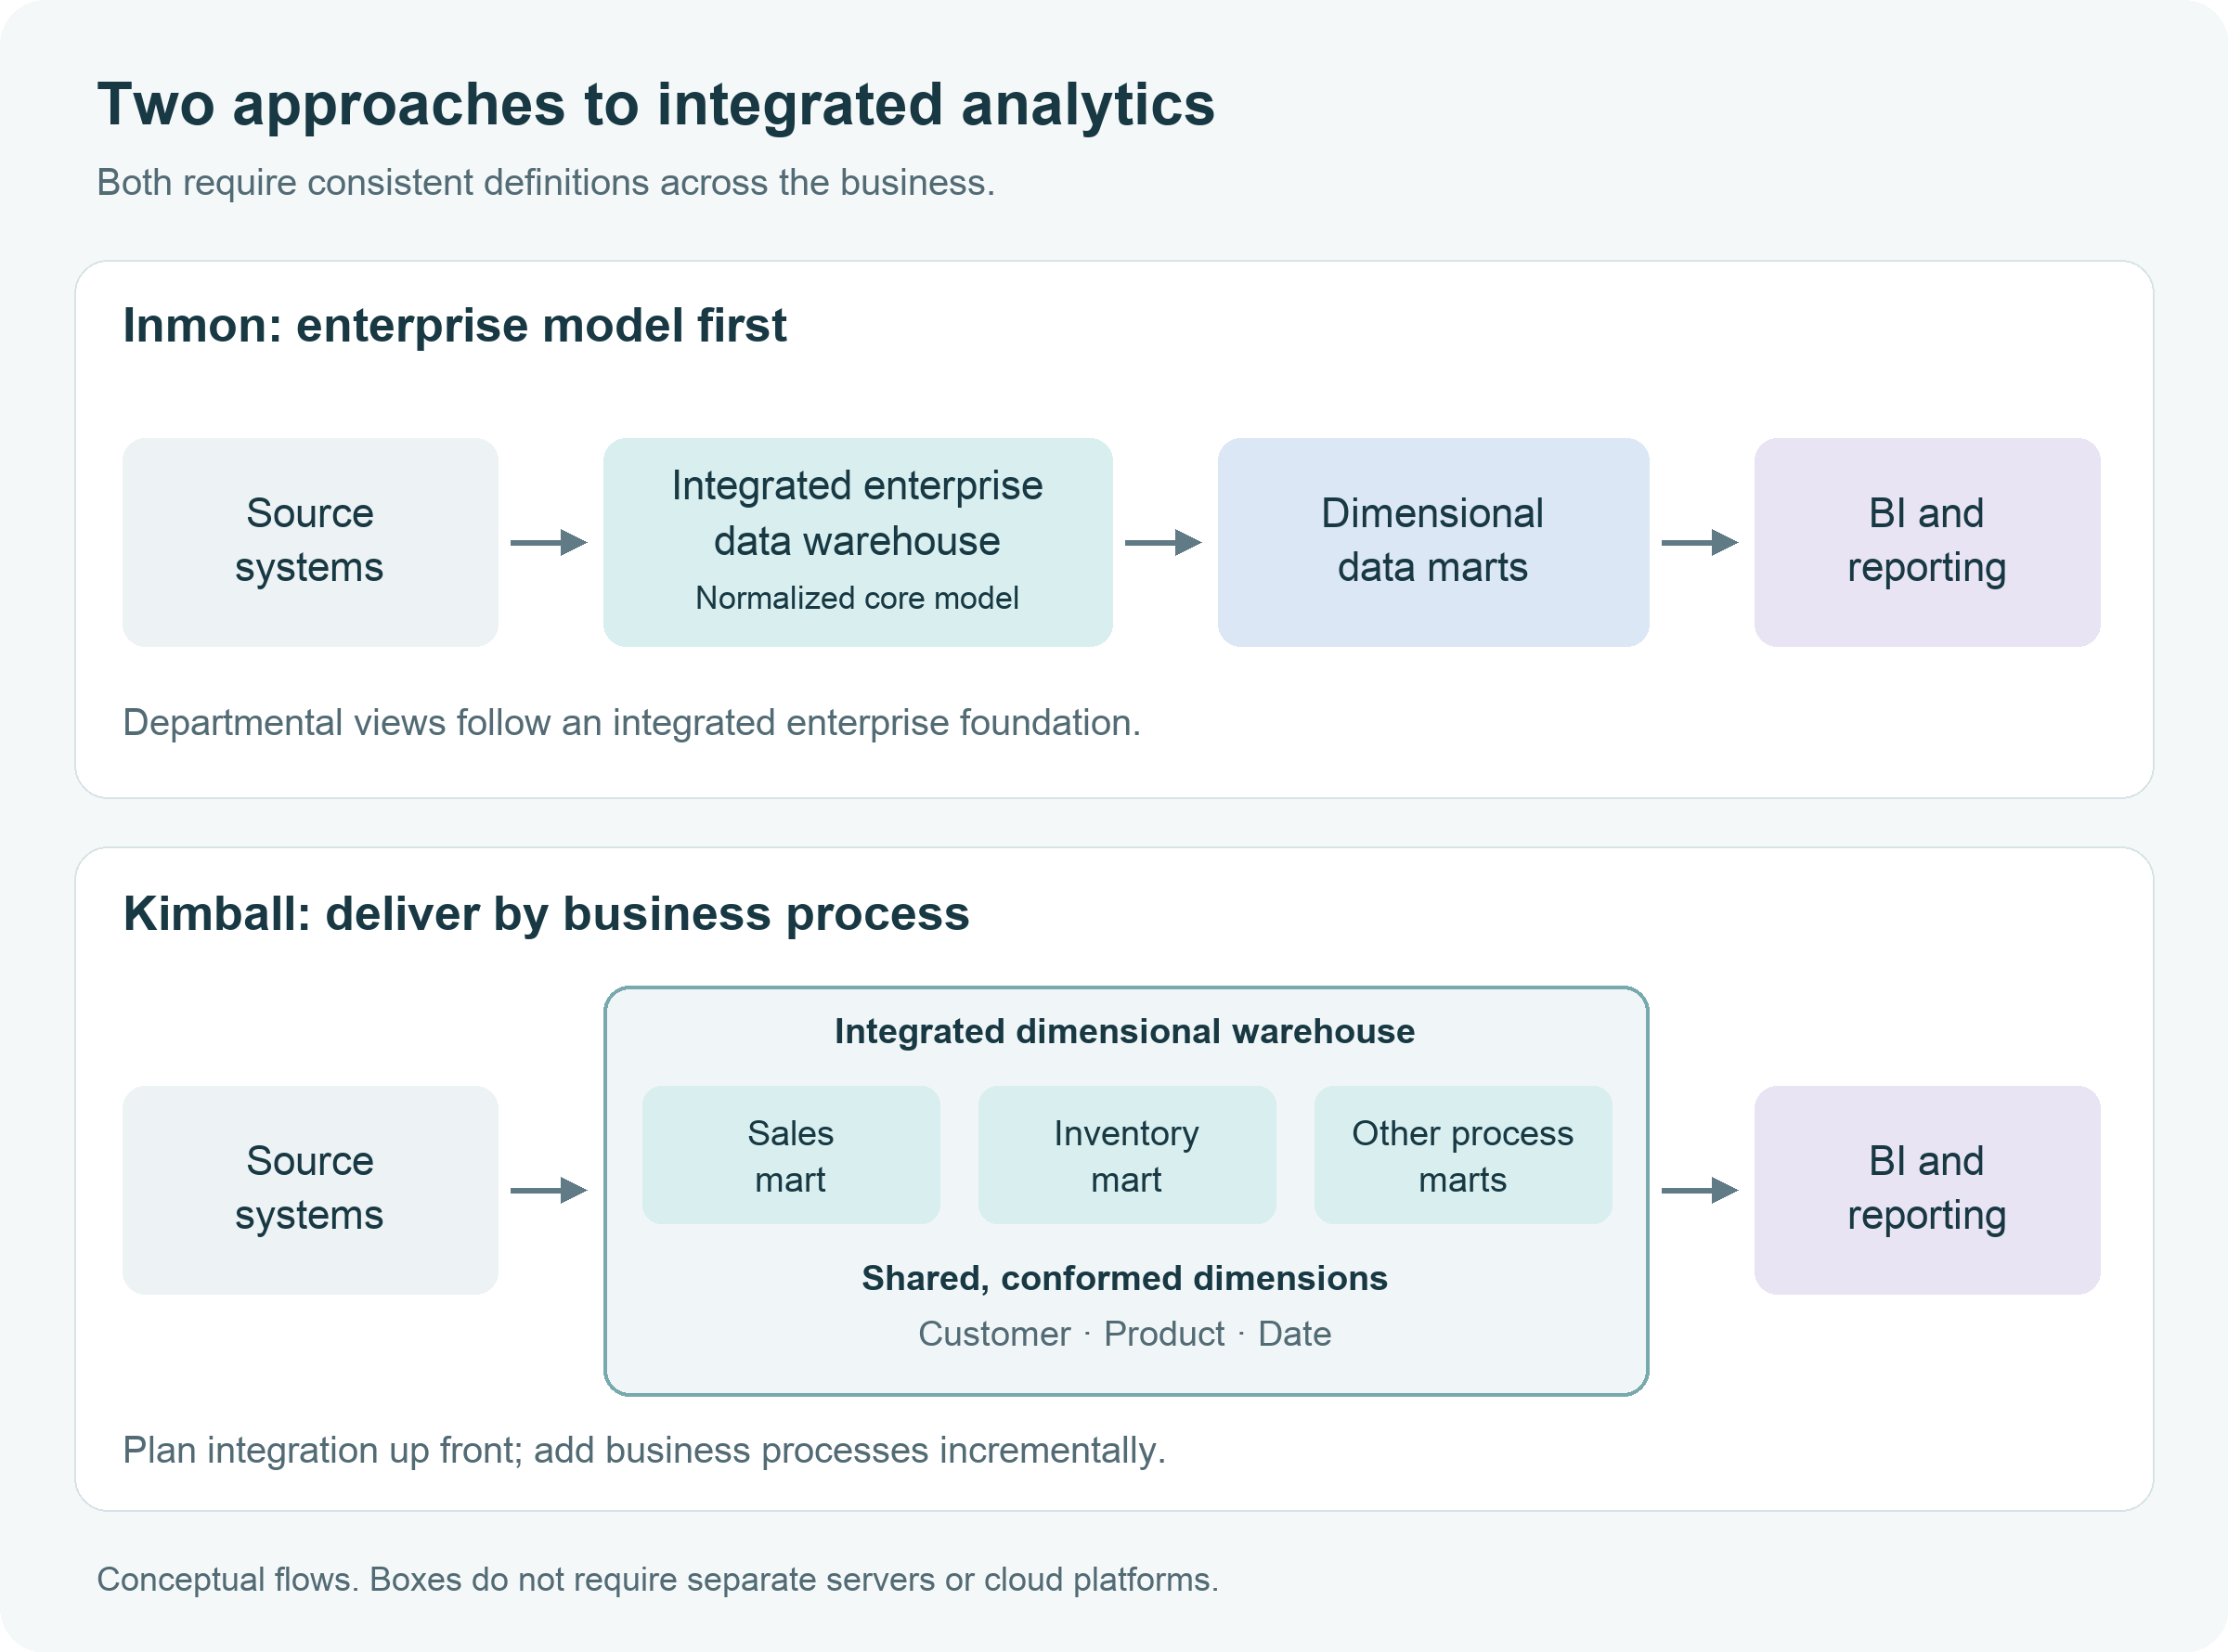
Both approaches plan integration. The boxes show logical roles and do not require separate servers.
When should you use a mart, a warehouse, or both?
Choose according to the reporting problem and the data foundation you already have.
- One focused need with limited dependencies: a narrowly scoped mart may be a practical starting point. Define its owner and metrics before expanding it.
- Reporting across several business functions: prioritize integration and shared definitions in a warehouse architecture.
- A warehouse that users struggle to navigate: add curated marts that expose the relevant tables, measures, and permissions.
- Several marts producing conflicting figures: reconcile definitions and sources before building another reporting layer.
Write down one important business question, the source data required to answer it, and the level of detail needed. That gives you a more useful design brief than choosing a platform based on whether it advertises a warehouse or a mart.
Further reading
- Data warehouse guide: the foundations of analytics storage and reporting.
- Traditional vs. cloud data warehouse architecture: how deployment choices affect your design.
- Warehouse pricing playbook: planning costs around your workload.
Frequently asked questions
Can you build a data mart without a data warehouse?
Yes. An independent mart takes data directly from source systems. It still needs transformations, quality checks, and ownership; skipping a central warehouse does not remove those tasks.
Is a data mart always smaller than a data warehouse?
A mart has a narrower analytical scope, but there is no universal storage threshold that determines the label. Data volume depends on the business process, history retained, and record detail.
Does a data mart need its own database?
No. You can implement a mart with curated tables or views inside a shared platform. A separate database or compute environment is an implementation choice based on requirements.
Do data marts only store summarized data?
No. A mart can include detailed records and aggregates. Define what each table’s rows represent so users can combine data without double-counting measures.
Snowflake, BigQuery, Redshift, Databricks, Fivetran, Airbyte and the rest, with pricing and what each one replaces.
Browse the tools