Data Warehouse Guide
Data Warehouse Tutorial
This conceptual guide introduces important aspects of data warehousing, with links to additional resources to help you go in-depth:
- What is a Data Warehouse? A basic definition, and the difference between data warehouses, data lakes and relational databases.
- Data Warehouse Solutions—popular data warehouse products, including on-premise and cloud.
- Data Warehouse Concepts—traditional vs. cloud-based data warehouses.
- Data Warehouse Architecture—traditional three-tier architecture vs. a reference cloud-based architecture.
- Data Warehouse Infrastructure and Technology—a quick review of Simple Query Language (SQL) as a foundation for the data warehouse, Extract-Transform-Load (ETL) infrastructure and tools, and Online Analytical Processing (OLAP) servers.
- Data Warehouse Design Process—the traditional waterfall design process, and how cloud technology is making data warehouses agile and flexible.
- Data Warehouse Modelling and Schemas—an overview of structured vs. unstructured data, basics of data modeling, multidimensional data modeling, and snowflake vs. star schema.
- Data Warehouse Partitioning and Data Marts—a survey of Bill Inmon’s Enterprise Data Warehouse vs. Ralph Kimball’s departmental Data Marts and partitioning strategies in the cloud.
- The ETL Process—a brief review of the traditional ETL process step-by-step, data warehouse testing, and a new, flexible data loading process based on Extract-Load-Transform (ELT).
- Data Warehouse Security—an understanding of user access, data movement, auditing and documentation.
- Data Warehouse Backup—models for backing up critical data warehouse data, and new backup strategies in the cloud.
- The Future of the Data Warehouse—an analysis of cloud-based data infrastructure and next-gen data warehouses, capable of creating new value and possibilities for your data team.
Note: This conceptual tutorial provides overviews and best practices for major aspects of data warehouse infrastructure. For a detailed step-by-step guide, consult the user documentation of your data warehouse product of choice. To learn how to set up a data warehouse and go from data to insight in minutes, see Panoply’s getting started guide.
What is a Data Warehouse?
A data warehouse is a decision support system which stores historical data from across the organization, processes it, and makes it possible to use the data for critical business analysis, reports and dashboards.
A data warehouse system stores data from numerous sources, typically structured, Online Transaction Processing (OLTP) data such as invoices and financial transactions, Enterprise Resource Planning (ERP) data, and Customer Relationship Management (CRM) data. The data warehouse focuses on data relevant for business analysis, organizes and optimizes it to enable efficient analysis.
In this data warehouse tutorial we’ll review the basic elements of a data warehouse, with a special emphasis on what’s new and different in cloud-based data warehouse architectures, and how they can move your data team light years forward.
Characteristics of Data Warehouses in the Cloud
Data warehouses have been around for years, and will continue to be core to enterprise data infrastructure—but they are undergoing massive change. New cloud-based data warehouses are changing the game, by offering higher performance, unlimited scale, faster time to market, and innovative data processing capabilities at a fraction of the cost of traditional, on-prem solutions.
Perhaps the most important change is that cloud-based data warehouse offerings are provided as a managed service. This removes the burden of setup and operations from the enterprise to the cloud provider. It also removes the huge upfront expenses that were previously required for data warehouse projects—converting data warehouse infrastructure from a capital expenditure to an operating expense, starting from only a few hundred dollars per month.
Go in depth with the blog post: Enterprises Eye Big Benefits from Cloud Data Warehouses
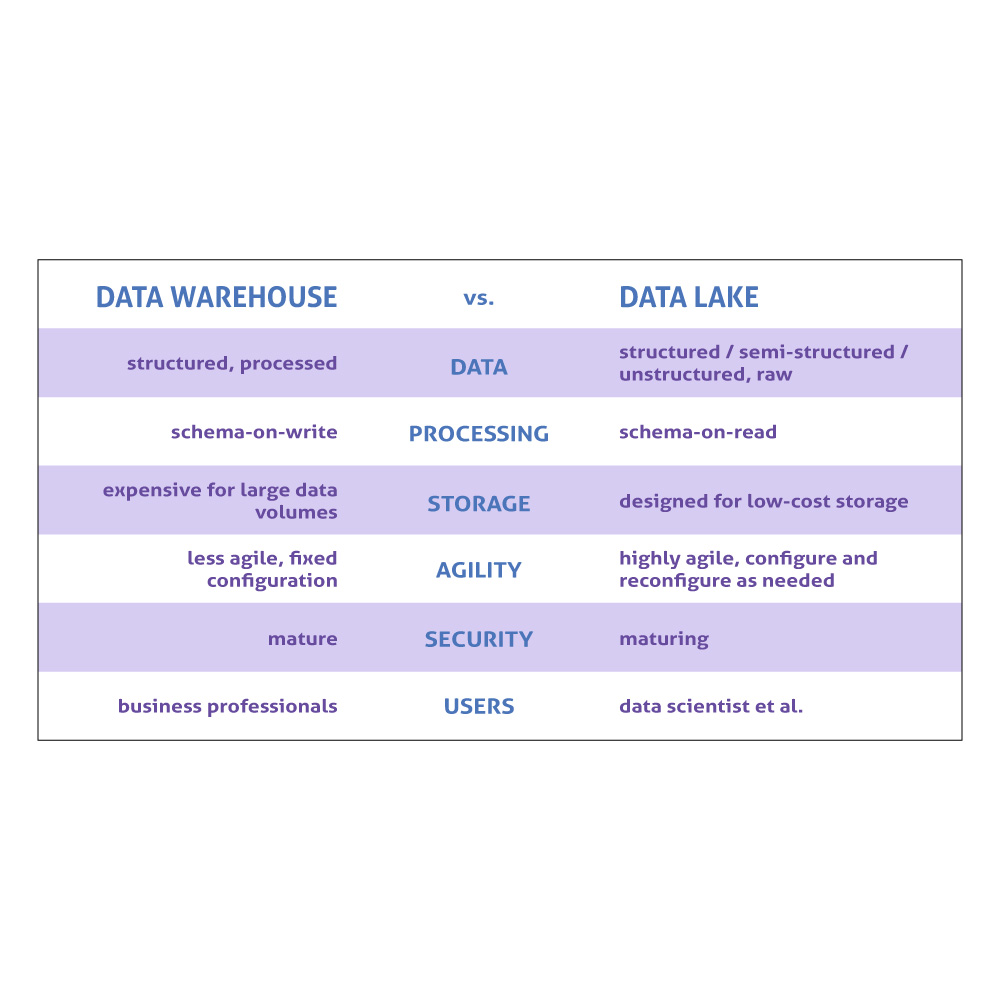
Data Lake vs. Data Warehouse
Organizations use data warehouses and data lakes to store, manage and analyze data:
- Data warehouses store structured data, cleaned up and organized for specific business purposes, and serve it to reporting or BI tools used by analysts and business users.
- Data lakes are a newer technology that stores both structured and unstructured data in its original form, and processes it later on-demand.
The key differences between data lakes and warehouses are summarized in this table:
Today many organizations are moving to cloud-based data warehouse solutions, such as:
- Amazon Redshift—a fully-managed, analytical data warehouse
- Google BigQuery—an enterprise-grade cloud-native data warehouse using a serverless computing model
- Panoply—the world’s first cloud data platform, with a streamlined setup that lets you start syncing and storing data in minutes
The options for running cloud-based data lakes include:
- Amazon S3—an object storage platform built to store and retrieve any amount of data from any data source, and designed for 99.999999999% durability.
- Azure Blog Storage—stores billions of objects in hot, cool, or archive tiers, depending on how often data is accessed. Can store structured data (converted to object form) and any unstructured format—images, videos, audio, and documents.
Read the in-depth guide: Data Lake vs. Data Warehouse: Working Together in the Cloud
Database vs. Data Warehouse
A data warehouse is technically a relational database, but is structured and optimized for the purpose of storing and reporting on historical data.
The key differences between a database and data warehouse are:
- Optimization—databases are optimized to maximize speed and efficiency of updates, whereas data warehouses are optimized for reading, aggregating, and querying large data sets.
- Data structure—databases typically use a normalized data structure. Data is organized so it contains no redundancies, but requires complex queries to access. Data warehouses typically use a denormalized structure with few tables, to improve performance for large-scale queries and analytics.
- Data timeline—databases process day-to-day transactions and don’t usually store historic data. Data warehouses are mainly intended to store historical data, loading copies of transactions over long periods of time.
- Analysis—while databases are normally used for transactional purposes, analysts can perform analytical queries against a regular database. However, because a database is typically normalized, the analyst must use complex queries, and is limited to analyzing a one-time snapshot of the data. A data warehouse enables much simpler querying against large volumes of historic data.
- Concurrent users—OLTP databases can support thousands of concurrent users. Data warehouses only allows a limited number of concurrent connections, because it is used by a small group of analysts and business users.
The advantages of a data warehouse architecture are:
- High performance querying on large volumes of data
- Simpler queries to allow in-depth data exploration
- Collects historical data from multiple periods and multiple data sources from across the organization, allowing strategic analysis
- Provides an easy interface for business analysts and data ready for analysis
Read the in-depth guide: The Difference Between a Database and Data Warehouse
Data Warehouse Solutions: On-Premise and Cloud-Based
The data warehouse is moving to the cloud. On-premise data warehouse tools are still popular and deployed at numerous large organizations. But while traditional data warehouse implementation was typically a million-dollar project, new cloud-based tools allow enterprises to setup a data warehouse in days, with no upfront investment, and with much greater scalability, storage and query performance.
On-Premise Data Warehouse Tools
While the focus of this data warehouse tutorial is on cloud data warehousing, a familiarity with on-premise data warehouse tools may still be helpful. Some of the popular on-premise data warehouse tools include:
Cloud Data Warehouse Tools
Amazon Redshift
Amazon Redshift, one of the most popular cloud services from Amazon Web Services, is a fully-managed, analytical data warehouse that can handle petabyte-scale data, and enables analysts to query their data in seconds. With no upfront costs, Redshift offers limitless scalability on Amazon’s architecture. By adding nodes to the Redshift cluster, or adding more clusters, you can support higher data volumes or high concurrency. Redshift has several alternatives but it remains the incumbent in the cloud data warehouse market, according to the 2018 data warehouse trends report.
Pricing: 2 months free trial, pricing starts from $0.25 per hour for one Redshift instance, up to $1,000 per terabyte per year for larger deployments
Go in-depth with Amazon Redshift:
- Read the blog posts:
- Read the in-depth guides:
Google BigQuery
Google BigQuery is an enterprise-grade cloud-native data warehouse. This economical and fully-managed data warehouse can run fast interactive and ad-hoc queries on datasets of petabyte scale. BigQuery integrates with a variety of Google Cloud Platform (GCP) services and third-party tools.
BigQuery is serverless—there are no servers to manage or database software to install. It manages the underlying software and hardware transparently, including scalability and high-availability.
Pricing: $5 per 1 TB of data processed.
Go in-depth with Google BigQuery:
- Read the blog post: Redshift vs. BigQuery: The Full Comparison
- Read the in-depth guide: A Deep Dive into BigQuery Architecture
Panoply
Panoply is the world’s first cloud data platform, which provides end-to-end data management.
Panoply is based on an Extract-Load-Transform (ELT) paradigm—it loads raw data into a data warehouse using built-in data source integrations. You can schedule updates so your data’s always fresh and ready for immediate business analysis.
Pricing: See complete pricing
Go in-depth with Panoply:
- Read the blog post: The Power Struggle in the Cloud DB War
- Introduction to Panoply platform
- Panoply integrations
- Getting started guide
- Panoply community
Data Warehouse Concepts with Examples
Data warehouse concepts are evolving with the introduction of cloud-based data infrastructure. Learn data warehouse concepts for beginners, as well as advanced concepts like ETL, ELT and clustering in cloud-based data warehouses.
Traditional Data Warehouse Concepts
- Dimension: Categorizes and provides context for facts and measures, enabling analysis.
- Conceptual model: Defines high-level data entities and relationships between them.
- Logical model: Describes data relationships, entities and attributes in as much detail as possible, without details of implementation.
- Physical model: Represents how to implement data design in a specific database system.
- Fact table: A table consisting of “facts”, metrics or measurements, for a business process and their related dimensions.
- Dimension table: Describes dimensions using dimension keys, values and attributes.
- Data warehouse schema: Defines the structure of the data warehouse—how fact tables are split into dimension tables
Read the in-depth guide: Data Warehouse Concepts: Traditional vs. Cloud
- Inmon approach: Bill Inmon introduced a top-down approach, which sees the data warehouse as the centralized data repository for the entire enterprise.
- Enterprise Data Warehouse: Consolidates data from across the entire enterprise (as advocated by Inmon).
- Kimball approach: Ralph Kimball described a data warehouse as several separate, specialized data marts, created for the use of different departments.
- Data Mart: a mini-data-warehouse focusing on a specific business subject (as advocated by Kimball).
Read the in-depth guide: Data Mart vs. Data Warehouse
- OLTP: Online transaction processing systems—fast production databases which typically feed data into the data warehouse.
- OLAP: Online analytical processing systems that analyze historical transaction data using read-only queries and aggregations.
Learn more in the Data Warehouse and OLAP section below.
- ETL: Ingests data into the data warehouse by extracting it from source, transforming and optimizing it for analysis, and loading in batches to the data warehouse.
- ELT: A variation on ETL that extracts raw data, including unstructured data, loads it into the data warehouse, and then transforms the data as required for analysis.
Read the in-depth guide: 3 Ways to Build An ETL Process
Cloud Data Warehouse Concepts—Amazon Redshift as Example
- Redshift Cluster: A group of shared computing resources in the cloud which runs data warehouse operations in parallel.
- Node: A computing resource within a cluster. In Redshift each node has its own CPU, RAM, and hard disk space. Nodes are further split up into slices that can perform compute tasks.
- Columnar storage: Redshift stores values in columns rather than rows, which is optimal for aggregated queries.
- Compression: Redshift leverages its columnar architecture to compress data that has a similar or repetitive format across table columns.
- Data loading: Getting data from sources into the cloud-based data warehouse. In Redshift, more frequently data is loaded from Amazon S3 via the COPY command. Data can also be loaded from other sources, or streamed using the Amazon Kinesis service. There are several ways to perform ETL into Amazon Redshift.
- Ad hoc queries: The Amazon Redshift Spectrum service can perform queries on vast amount of data in an S3 data lake, without loading the data into the data warehouse.
Read the in-depth guide: Amazon Redshift Architecture.
Components of a Data Warehouse
Data warehouse architecture hasn’t changed much for more than two decades. But recently, new cloud-based solutions turned things upside down.
Traditional Enterprise Data Warehouse Architecture
Traditionally data warehouses were built using a three-tier architecture:
- Bottom tier—database server used to extract data from multiple sources
- Middle tier—OLAP server, which transforms data to enable analysis and complex queries
- Top tier—tools used for high-level data analysis, querying, reporting, and data mining
Data warehouses were structured using one of the following models:
- Virtual data warehouse—a set of separate databases, which can be queried together, forming one virtual data warehouse.
- Data mart—small data warehouses set up for business-line specific reporting and analysis. An organization’s data marts together comprise the organization’s data warehouse.
- Enterprise data warehouse (EDW)—a large data warehouse holding aggregated data that spans the entire organization.
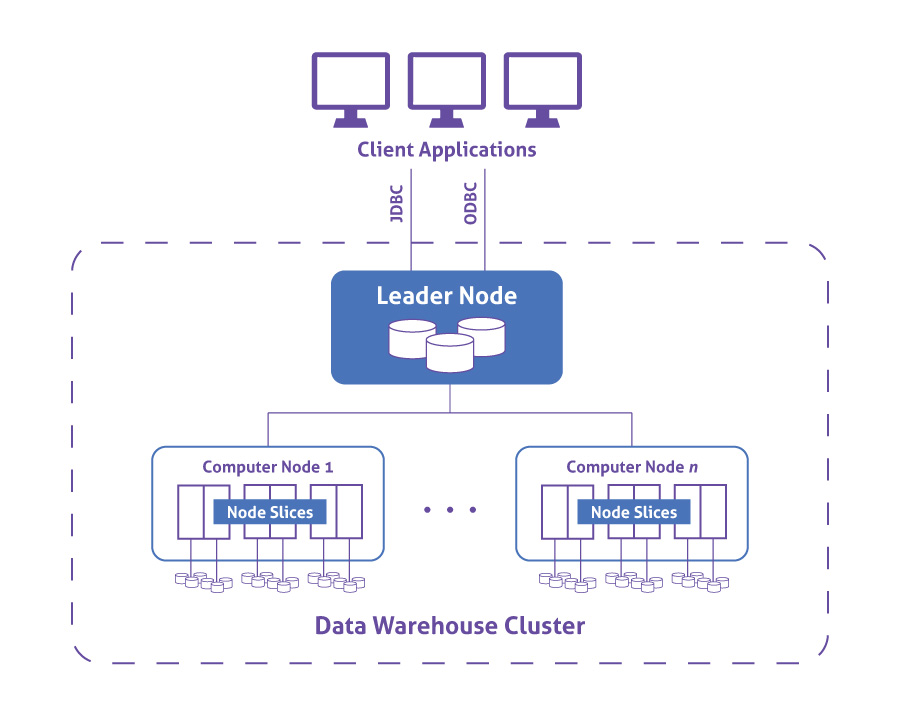
Cloud Data Warehouse Architecture—Amazon Redshift as an Example
In Amazon Redshift, computing resources are provisioned in clusters, which contain one or more nodes. Each node has its own CPU, storage, and RAM. A leader node compiles queries and transfers them to compute nodes, which execute the queries.
On each node, data is stored in chunks, called slices. Redshift uses columnar storage, meaning each block of data contains values from a single column across a number of rows, instead of a single row with values from multiple columns.
Go in-depth:
- Read the in-depth guide: Data Warehouse Architecture
- Read the blog post: Enterprises Eye Big Benefits from Cloud Data Warehouses
Data Warehouse Infrastructure and Technology
A data warehouse, at its core, is a relational SQL database. But around that database are several technology components that work together to facilitate data processing and reporting:
Read the in-depth guide: Data Warehouse Tools: 12 Easy, Inexpensive Tools in the Cloud
Data Warehouse and SQL
The standard way to work with data in a warehouse is using structured query language (SQL). SQL is a standard query language which can be used to:
- Execute queries to ask structured questions and receive answers from the data
- Retrieve data to view the content of the data warehouse
- Insert, update or delete records in the data warehouse
- Create new tables, views, or stored procedures (subroutine that runs multiple SQL commands) in the data warehouse
- Set permissions on tables, views, and procedures
All the tools in the data warehouse stack—including ETL tools, data preparation tools, OLAP servers and business intelligence tools—use SQL to read, write, and query data to and from the data warehouse. Analysts and data scientists also use SQL syntax to frame questions they want to answer using the data warehouse.
ETL Technologies and the Advent of ELT
Extract, Transform, Load (ETL) technology uses batch processing to pull data out of its source, modify it according to reporting requirements, and load the transformed data into a data warehouse. An ETL process in a data warehouse helps businesses turn raw data into a data set that can help make data-driven business decisions. ETL is considered the most complex part of data warehouse development.
A variety of ETL tools are used to load data into data warehouses:
- Traditional on-premise ETL tools such as Informatica and Ab Initio.
- Open source ETL tools such as Talend, Apache Camel and Apatar.
- Stream processing tools, which allow real-time streaming and transformation of data, such as Apache Kafka and Apache Samza.
- Cloud-based ETL services such Segment, Stitch and Blendo.
Today there are new tools that follow a different process: Extract, Load, Transform (ELT). ELT is a game changer, because it allows analysts to query and analyze big data directly, without setting up a complex ETL process. You can read an in-depth comparison of the two approaches in ETL vs. ELT: The Difference is in the How.
Cloud-based ELT tools include:
- Amazon Redshift Spectrum—queries huge volumes of data on Amazon S3
- Panoply—loads raw data as-is, provides the option of in-tool transformation via SQL views, and makes it available for querying by a variety of BI and analytical tools
Go in-depth:
- Jump to read about the ETL Process below.
- Read the blog post: 11 Great ETL Tools and the Case for Saying No to ETL
- Read our in-depth guide: 3 Ways to do Redshift ETL in 2018
Business Intelligence Lifecycle and Tools
Business intelligence (BI) is a process for analyzing data and deriving insights to help businesses make decisions. Analysts and data scientists use BI tools to discover meaningful hypotheses and answer them using available data.
Preparing data for BI can be complex and time consuming. You’ll need to process raw data before you can derive meaningful insights. A data warehouse is crucial in this process, because it aggregates data from across the organization and stores it in a format that enables analysis.
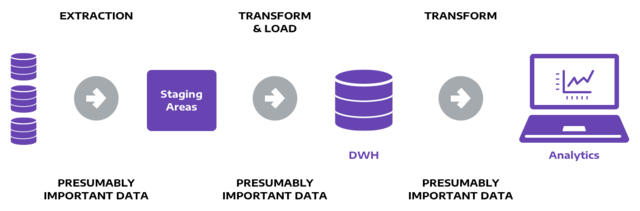
As an organization, you’ll follow this general process to go from raw data, to optimized, organized data in a data warehouse, to enable effective analysis via a BI tool:
- Identify data for analysis.
- Transform data into BI-ready format—perform queries on the raw data to evaluate data quality, decide which tables are not relevant, and which are relevant and might need to be transformed. Then transform the data into a format suitable for analysis (typically done in a staging DB).
- Test the system with manual queries—run sample queries to see if the data can answer your business questions.
- Load data into the data warehouse.
- Connect BI tools to the data warehouse.
- Build the reports—create reports and dashboards in your BI tool to let business users view and interact with the data.
Today, data warehouses and BI tools are moving towards a process called Extract-Load-Transform (ELT), in which data is loaded first to the data warehouse or data lake, and then transformed and analyzed.
In an ELT paradigm, the BI process looks like this:
- Identify data for analysis.
- Load data into the data warehouse → this step is performed at the beginning
- Connect BI tools to the data warehouse.
- Transform data to be BI ready → this step is performed after data is already in the data warehouse, which eliminates the complexity of the traditional ETL process.
- Test the system with manual queries.
- Build the reports.
Dive deep into the BI process:
- Read the blog post: A Business Intelligence Example: How to Prepare Data for Analysis
- Read the blog post: Business Intelligence Architect: Defining the Role
- Read the in-depth guide: BI and Data Warehousing: Do You Need a Data Warehouse Anymore?
Go in-depth—connecting BI to data warehousing tools:
- Read the blog post: Embedded Analytics with Power BI and Azure
- Read the blog post: Connecting to Data Warehouses in Tableau
- Read how to connect BI tools to Panoply’s ELT-based data warehouse: Connecting BI Tools to Panoply
Data Warehouse and OLAP
Online Analytical Processing Servers (OLAP) enable complex queries on large data sets, with fast, consistent, and interactive access to the data. Every data warehouse has a built-in OLAP server, or works together with an OLAP server to facilitate querying and reporting.
OLAP powers sales reports, marketing reports, business process management (BPM), forecasting, budgeting, finance reports, and many other forms of business analysis in large organizations.
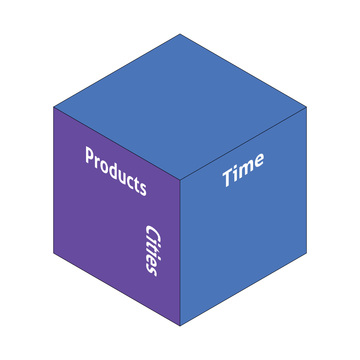
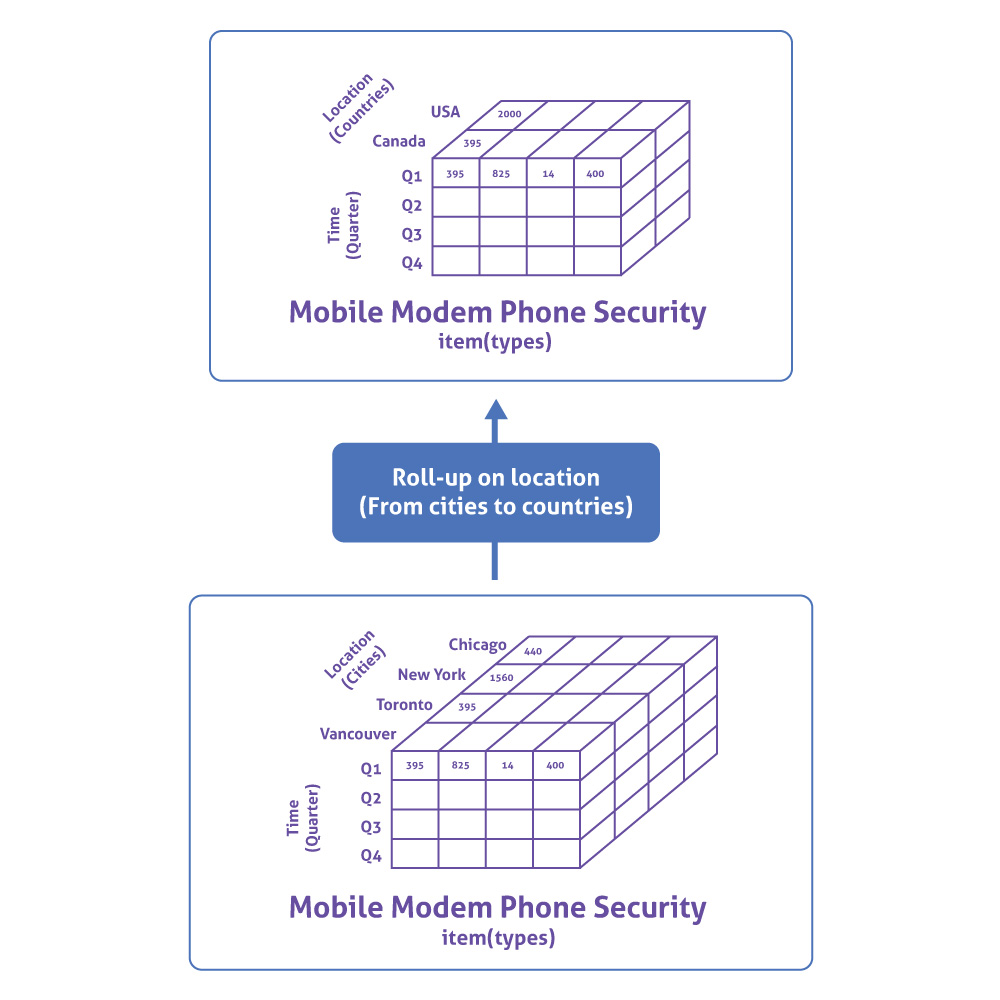
OLAP is based on the concept of data cubes. A cube is defined by measures—alphanumeric values—and dimensions which provide context. For example, below is a three-dimensional OLAP cube with the following dimensions: Products, Cities (in which product was purchased), and Time (of purchase).
Every point within the cube represents a specific data point—for example: (Product A, New York, 1.1.2018). Moving up or down in the cube gives you a data point with the same product and purchase time, but purchased in a different city. Similarly, moving left/right changes product values, and moving deeper into the third dimension changes the purchase date.
OLAP Data Operations
Roll-up
Aggregation can be performed on a data cube by climbing up a concept hierarchy for a dimension. This is also called dimension reduction.
For example, if you are viewing data for the following set of dimensions: Industry > Company > Department, a roll up would involve removing the Department dimension and viewing data for the entire Company.
Drill-down
Drill down is the reverse of roll up. Done by stepping down a concept hierarchy, or introducing a new dimension. If the concept tree is Industry > Company > Department, and you are currently viewing data for an Industry, a drill-down could involve adding a dimension and showing a smaller set of data for a specific Company.
Slice and dice
Slicing selects one dimension from a cube and provides a new sub-cube. For example, an OLAP server can provide a new data cube restricted according to the criteria: “Time = January 2018”.
Dicing selects two or more dimensions and provides a new sub-cube.
Pivot
Also known as rotation, pivot rotates data axes to provide another view of the data. For example, in a table with regions in the vertical axis and types of customers in the horizontal axis (customers per region), the data can be pivoted to see which regions are most frequent for each customer type.
MOLAP, ROLAP and HOLAP
- Relational OLAP (ROLAP)—an intermediary server between relational databases and client front-end tools. ROLAP stores data warehouse data using a relational DBMS format. A ROLAP server optimizes the DBMS back-end, implements and aggregates data to facilitate OLAP query navigation.
- Multidimensional OLAP (MOLAP)—uses specialized storage engines to enable multidimensional views of data. It the data set is sparse (some dimensions do not include data across all records) MOLAP can significantly reduce storage size, by using two separate storage formats for dense and sparse data sets.
- Hybrid OLAP (HOLAP)—a combination of ROLAP and MOLAP, with improved scalability for ROLAP and higher performance for MOLAP. HOLAP servers use a ROLAP-like DBMS representation for large data sets and stores aggregations separately in a MOLAP-like multidimensional representation.
Data Warehouse Design Process
In the past, a data warehouse was a huge project that required meticulous planning. There were several stages involved in data warehouse design, and design was critical to the success of the project.
Today, organizations are adopting cloud-based data infrastructure, with a decreased reliance on ETL. It is now possible to load raw data to the data warehouse and transform it on-demand, a process called Extract-Load-Transform (ELT). This has greatly simplified the data warehouse design process, because it’s no longer necessary to plan the entire data processing workflow in advance.
Traditional Data Warehouse Design Example
- Requirements Gathering—determine the long-term business strategy, current business and technical requirements, user needs, reports and KPIs requested by management. Because the data warehouse is a mission-critical infrastructure, it requires a business continuity strategy including solid backup and recovery.
- Physical Environment Setup—define the physical environment for the data warehouse. This will include, at a minimum, an application and database server, and typically also separate servers for ETL, OLAP, cube, and reporting processes. Separate physical environments makes it easier to test changes and address data integrity issues, without affecting the production environment.
- Data Modeling—define how data structures will be accessed, connected, processed, and stored in the data warehouse. Identify data sources, their current structure and taxonomy, and how to represent them in the data warehouse using measures and dimensions. You should obtain OLAP analysis specifications from the analysts who will query the data. They should provide:
- Grouping measures—values used to analyze data like revenue, number of customers, etc.
- Dimensions—providing context around measures, such as geographic region, month, or quarter.
- Granularity—the lowest level of detail that should be included in the OLAP dataset.
- ETL Planning—the ETL process is the most complex and takes up the majority of the implementation effort. The goal of ETL is to prepare data for reporting and analysis, and to load batches to the data warehouse quickly and with high quality. Failure at this stage can lead to poor performance and data quality issues in the data warehouse.
- OLAP Cube Design—the OLAP server will support ad-hoc user query and multi-dimensional analysis. Build the OLAP cubes according to the measures defined in step #3, data modeling. Ensure the OLAP cube process is optimized to improve time to analysis when data is updated, and to prevent data staleness.
- Report Development—ensure users can select report criteria easily and quickly generate reports. Users may need reports delivered securely over a browser, sent as an email attachment, or saved to a network drive as a spreadsheet. Define user groups and roles and assign permissions. The data warehouse should be able to support modifying reports without changes to the underlying data.
- Query Optimization—create separate development and testing environments, to enable performance tuning on the ETL, query processing, and report delivery processes, without interrupting the production environment. Continuously test and tune your separate environments and update the production environment after queries have passed in the test environment. Be sure to have a rollback procedure in place in case an update breaks production after passing in testing.
Cloud-Based Data Warehouse Design Process
In a cloud-based data warehouse, the design process is much more lightweight. It is still necessary to identify data sources and user needs. But it is now possible to ingest data into the data warehouse at the click of a button, explore and transform it while already in the data warehouse. This is a workflow known as Extract-Load-Transform (ELT).
ELT provides tremendous flexibility for analysts and data engineers, because they don’t have to devise the entire process—data model, ETL, OLAP cube structure, etc.—in advance. They can define the process on an ad-hoc basis, as new data streams into the data warehouse and as new user needs emerge.
Go in-depth with the blog post: Data Warehouse Design: The Good, the Bad, the Ugly
Data Modelling in a Data Warehouse
Data warehouses were traditionally based on a strict data model, and included only structured data. This is changing, and new data warehouses can ingest semi-structured and even unstructured data, and infer data models and schemas on the fly.
Learn more about:
- Structured vs. Unstructured Data
- Conceptual, Logical, and Physical Data Models
- Relational vs. Multidimensional Data Model
- Data Warehouse Schemas
- Data Warehouse Partitioning and Data Marts
Structured vs. Unstructured Data
There are three types of data which analysts and business users can leverage for analysis:
- Structured data—data stored in fields in a record or file, with a data model defining which data is in each field, the data type, logical restrictions on data, etc. Structured data is stored in databases, spreadsheets, and flat file formats like CSV.
- Unstructured data—data that does not have a predefined data model, or is not organized in a predefined manner. Much unstructured data is in text form—for example, social media messages, emails, and documents.
- Semi-structured data—also known as data with a self-describing structure, this data does not have a formal data model, but does have tags or metadata describing its content attributes. Examples are XML files, HTML files, and log files.
Traditionally, data warehouses could only store and process structured data. New data warehouse and BI solutions can increasingly deal with unstructured data. Using modern tools, you can automatically process unstructured and semi-structured data, and create structured extracts to facilitate analysis and reporting.
A few examples of tools that can process unstructured and semi-structured data:
- Opentext Content Analytics extracts machine-readable data from unstructured content. It can extract concepts from text, extract entities such as organizations or names, perform categorization, sentiment analysis, summarization, language detection and more.
- Import.io scrapes data from websites, including sites that use AJAX or where data is behind a login. It automatically learns the structure of a website, and the data can be exported to CSV/Excel or explored via BI tools like Tableau.
- Panoply is the world’s first cloud data platform that combines ETL and data warehousing with an easy-to-use no-code interface. Panoply can store all three data types in the data warehouse and facilitate on-the-fly analysis.
Conceptual, Logical and Physical Data Models
To develop a structured data model, data engineers use three stages of modeling to define the desired data structure and get feedback from owners of the data.
- Conceptual data model—determines high-level relationships between entities. For example, an Order is always tied to a Customer, a Date, a Product, and a Region.
- Logical data model—represents specific attributes of data entities. For example, a Product has a Product ID, Product Description, Category, Category Description, and Date Created.
- Physical data model—the most detailed model, specifying exactly how the database will be built—which tables the database will contain, which fields in each table, their data types, and logical restrictions on the data.
Relational vs. Multidimensional Data Model
Online Transaction Processing (OLTP) systems typically use a relational data model. Among its characteristics:
- Relationship between tables—a database is comprised of multiple tables. In an OLTP system, tables are linked to each other—for example, an Orders table contains the customer ID for each order, and a Customers table contains information about customers, each with a unique Customer ID. In this example, Customer ID is a key that joins the Orders and Customers tables.
- Data redundancy—OLTP systems typically normalize data to avoid redundancy and improve performance, to support large volumes of simple data operations.
OLAP systems used in data warehouses typically use a multi-dimensional data model. In a multi-dimensional model, data is described by:
- Dimensions—a data set that allows users to define, group and filter data. For example, in a data set describing financial transactions, dimensions can include Date, Transaction Amount, Customer, Product, and/or Region.
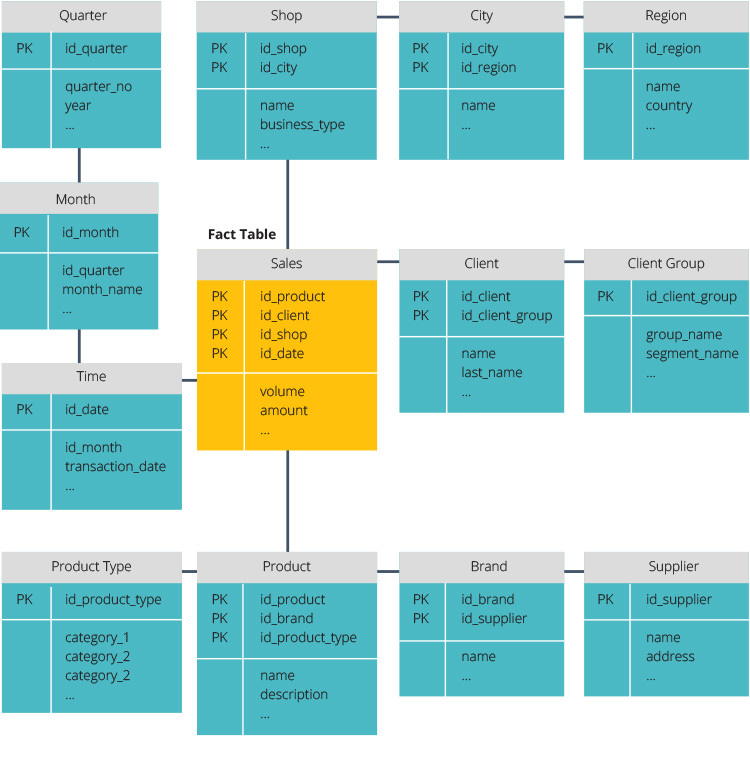
- Fact tables—tables that contain numerical data (measures) which can be used to answer quantitative business questions. For example, a fact table can hold transaction amounts and prices paid per product.

- Attributes—additional information, numeric or alphabetical, about the data entities. For example, Customer Number, Customer Name, and/or Customer Address.
Additional important concepts used in multi-dimensional data modeling include:
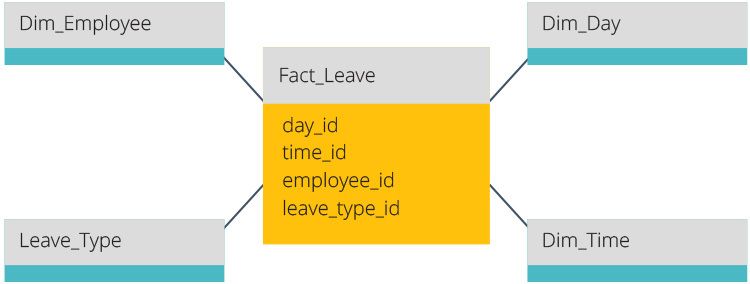
Factless Fact Table
A factless fact table is a fact table without any measures. It is useful when just the intersection between dimensions provides the necessary information. For example, a factless fact table containing the dimensions Customer ID, Product, and Store can provide information on which customers bought a certain product in that store. There is no need for specific measures in the table, because the intersection of Customer ID, Product and Store results in the desired list of customers.
Slowly Changing Dimension
Stores data which can change slowly but unpredictably over time. Data warehouses use several types of dimensions to reflect the likelihood that the data or its attributes will change:
- Type 0: Retain Original—this type of dimension contains attributes and values that never change—for example: Date of Birth or Country of Birth.
- Type 1: Overwrite—this type of dimension can be overwritten with new data, but attributes are not expected to change. For example, City of Residence for a Customer. If the customer moves, the city field is overwritten with the new value.
- Type 2: Add New Row—this type of dimension can record a history of multiple values for the same attribute. For example, under City of Residence, you can store multiple values indicating where the customer has lived in the past.
- Type 3: Add New Attribute—a dimension allowing new attributes to be added over time, as additional columns. For example, if there is an attribute called Original City of Residence, it is possible to add an attribute called Current City of Residence.
- Type 4: Add History Table—a dimension which holds the current data in one table, and has an additional table to keep track of historic changes to the dimension.
Junk Dimension
This dimension table combines several dimensions, which users do not need to query separately. For example, if each Order has a Transaction Code, Coupon Code and Credit Authorization Code, represented as separate dimensions, these three can be combined into one junk dimension table.
Junk dimensions help to reduce the number of dimensions in the original table, improving performance and making it easier to manage.
Conformed Dimension
A conformed dimension has exactly the same meaning and content when it is referred from different fact tables. For example, you can have a Customer dimension in one part of the data warehouse with Customer ID, Name, Address, and Phone Number, and another Customer dimension with Customer ID, First Name, Last Name, and Address. While these two dimensions represent the same entity, they are not conformed—they have different structure and content.
A typical example of a conformed dimension is Time, which should be represented in exactly the same way across the data warehouse or multiple data marts, to allow integration and comparisons across tables.
Data Warehouse Schemas: Star Schema and Snowflake Schema
The star schema and snowflake schema are two ways of organizing data warehouses. Both use dimension tables that describe the information contained within a fact table.
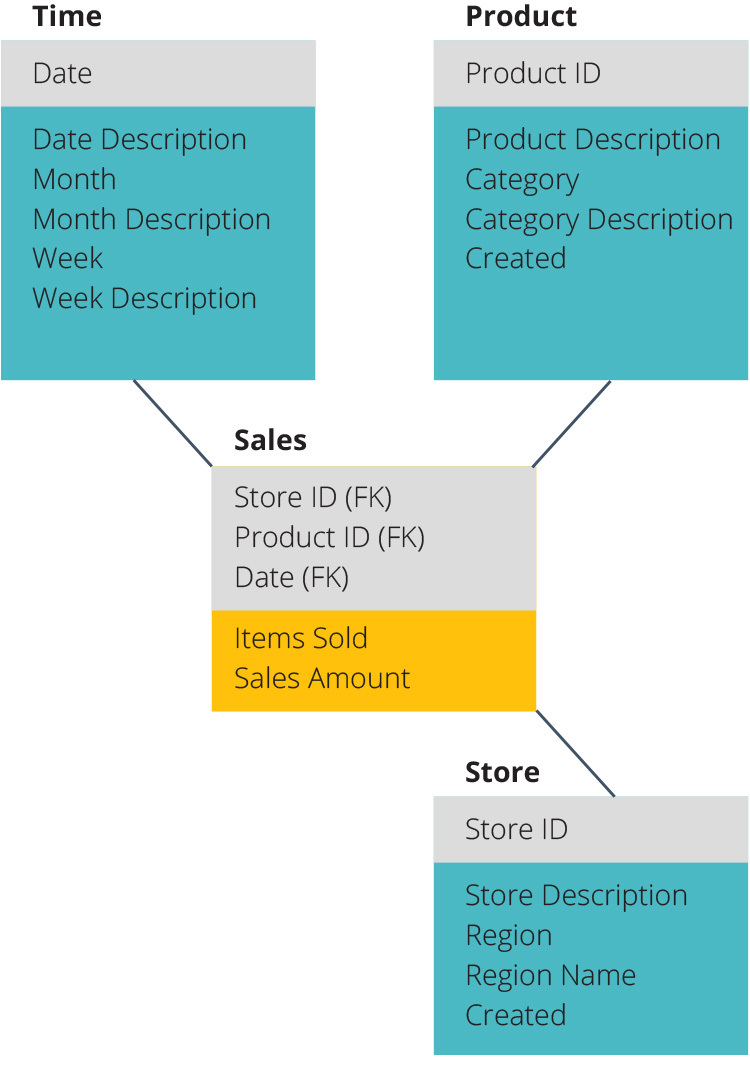
Star Schema
The star schema takes the information from the fact table and splits it into denormalized dimension tables, to improve query speed. Only one join is needed to link fact tables to each dimension.
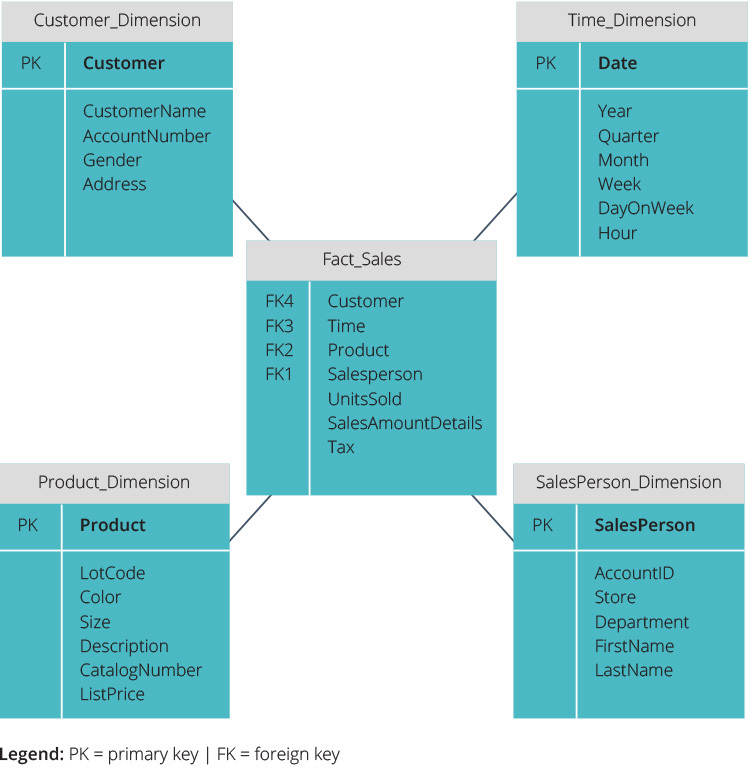
Snowflake Schema
The snowflake schema splits the fact table into normalized dimension tables. This creates more dimension tables with multiple joins and reduces data integrity issues. However, it reduces performance and makes querying more difficult.
Data Warehouse Partitioning and Data Marts
Traditionally, building an Enterprise Data Warehouse which held data for an entire organization, was a complex and expensive project. To reduce costs and complexity, many organizations partitioned data warehouses into smaller units called data marts. A data mart is a smaller data warehouse that serves the need of one department or business function.
Data marts can provide data for tactical decisions at a departmental level, while Enterprise Data Warehouses guide high-level strategic business decisions by providing a consolidated view of all organizational data.
Bill Inmon vs. Ralph Kimball
Bill Inmon and Ralph Kimball proposed two opposing data warehouse principles:
- Inmon proposed a top-down design—the Enterprise Data Warehouse is created first and is seen as the central component of the analytic environment, holding data for the entire organization. Data is then summarized and distributed from the centralized warehouse to one or more dependent data marts.
- Kimball proposed a bottom-up design—an organization creates separate data marts, which cover data used by specific departments—for example a data mart for finance, sales, customer support. Data marts are joined together to form an integrated data warehouse.
Cloud-based data warehouse solutions have made the data mart strategy less relevant. Solutions like Amazon Redshift, Google BigQuery and Panoply manage partitioning and scalability of the data warehouse in a transparent manner. So it’s possible to setup a petabyte-scale Enterprise Data Warehouse, holding all organizational data, without the cost and complexity of traditional data warehouse project.
Read our in-depth guide: Data Mart vs. Data Warehouse: Is the Data Mart Still Relevant?
The ETL Process
Traditional ETL Process
Extract, Transform, Load (ETL) is an automated process which takes source data, extracts information required for analysis, transforms it into a standardized format, and loads it to a data warehouse.
When you build an ETL infrastructure, you must integrate data sources, and carefully plan and test to ensure you transform source data correctly. The process involves:
- Reference data—create a set of data that defines the set of permissible values your data may contain.
- Extract from data sources—combine data from multiple source systems, converting each data set into a single format for standardized reporting.
- Data validation—enforce logical rules to see if the data “makes sense”. For example, in a database of financial transactions from the past year, check the date field to ensure it contains valid dates within the past 12 months.
- Transform data—cleaning extraneous or erroneous data, applying business rules, checking data integrity, and creating aggregates as necessary.
- Stage—do not load transformed data directly into the data warehouse—load it first to a staging database, to make it easier to roll back if something goes wrong.
- Publish to data warehouse—loading the data to target tables. Some data warehouses overwrite existing information with every load; in other cases, the ETL process can add new data without overwriting, using history tables.
Read the in-depth guide: 3 Ways to Build An ETL Process
Data Warehouse Testing in a Traditional ETL Process
ETL testing ensures that transformation of data from source to data warehouse is accurate, and verifies data at each point between source and destination.
Testing is an essential part of the data integration process. Data comes from numerous sources. The data source affects data quality, so data profiling and data cleaning must be ongoing—source data, business rules and audit information can and will change from time to time.
Follow this process to perform ETL testing in a traditional ETL process:
- Validate required data and data sources—review meta data, develop archival and purge strategy, and prepare test data.
- Data profiling—validate source to target mappings as well as define error logging and exception handling.
- Data quality and performance acceptance—validate the ETL architecture, test parallel execution and precedence, test OLAP as well as cube structure and complex queries.
- Data transformation rules—validate the data model—dimensional modeling and normalization, test pull logic (full/incremental) and test reports with drill down and drill through.
Read the in-depth guide: Data Warehouse Testing 101
New Data Loading Process with ELT
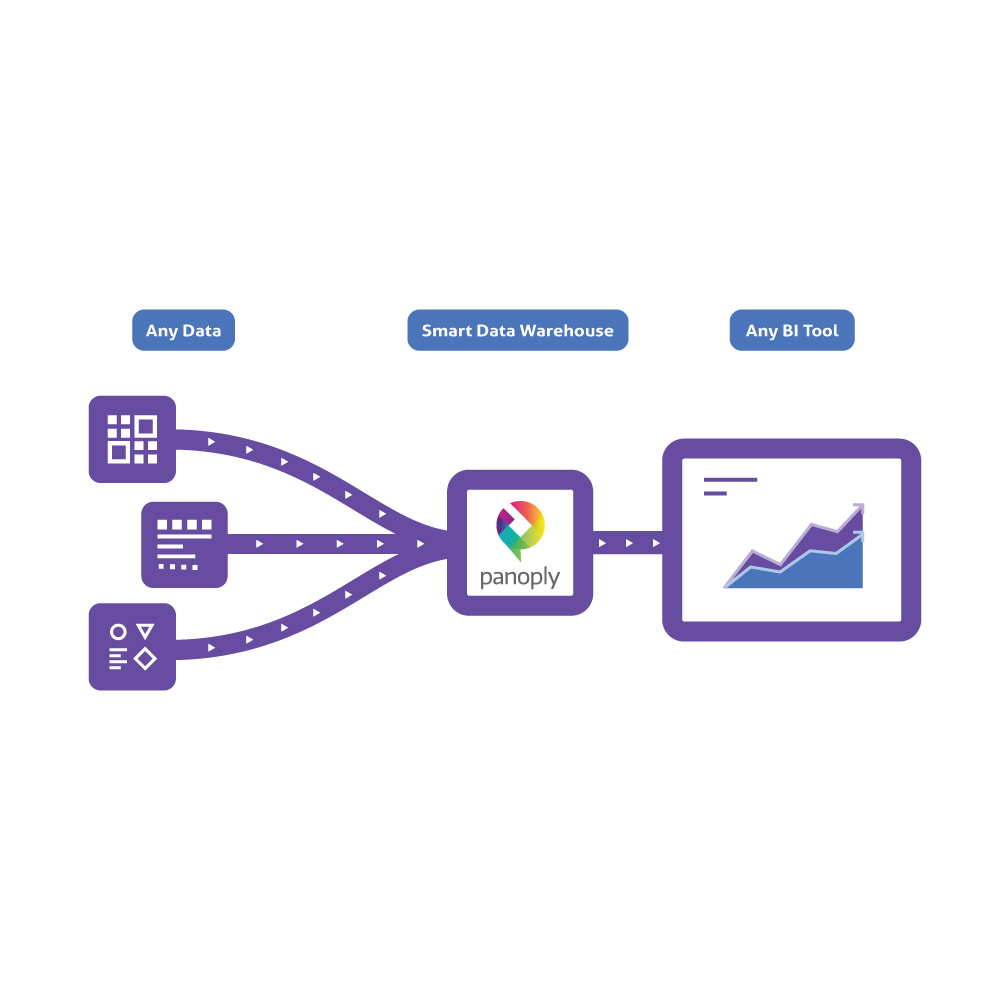
Extract-Load-Transform (ELT) is a new paradigm for loading data to a data warehouse. In an ELT process, after extracting data from all data sources, you immediately load it to a centralized data repository. Today’s cloud-based data warehouses support large storage and scalable compute, so it’s no longer necessary to keep data small and summarized. Many organizations maintain massive data pools in the cloud at low cost and leverage ELT tools for processing.
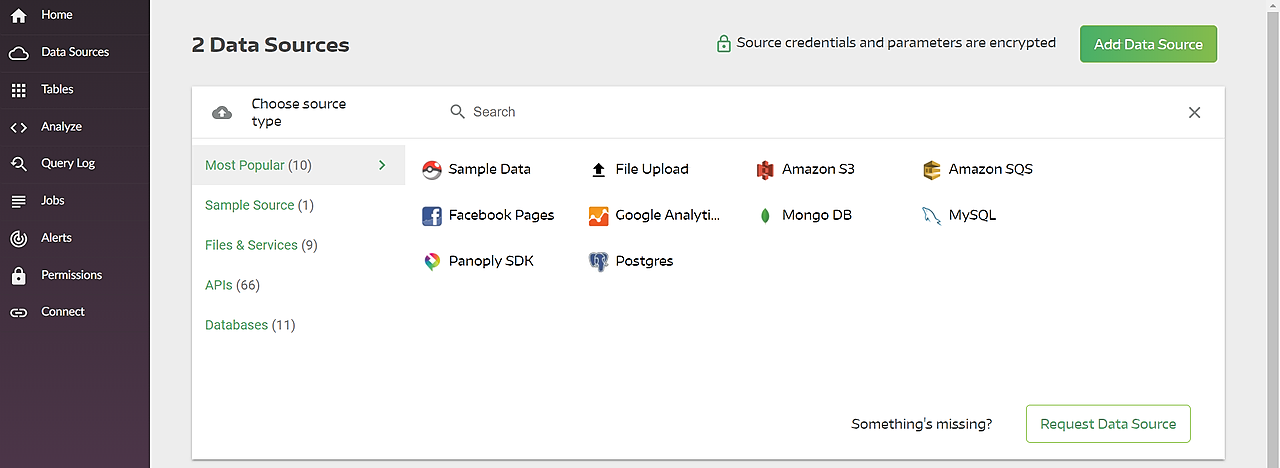
Panoply, a cloud data platform that supports ELT, allows you to create a data pipeline in a few simple steps:
- Select data sources and import data—select data sources, enter credentials, click Collect and Panoply automatically pulls the data for you. Panoply comes integrated with dozens of common data sources.
- Run transformation queries—select a table and run a SQL query against the raw data. You can save the query as a transformation, or export the resulting table into your own system. Panoply’s Query Log allows you to easily roll back to previous processing steps.
- Data analysis with BI tools—you can now connect any BI tool such as Tableau or Looker to Panoply and explore the transformed data.
That’s it—the ETL process makes it possible to go from raw data to analysis in three simple steps, without the complexity of traditional ETL batch processing.
Go in-depth:
- Read the blog post: ETL vs. ELT—the Difference is in the How
- Read the blog post: The Worst Advice We’ve Ever Heard about ETL
- Read the in-depth guide: 3 Ways to Build an ETL Process
- Read the in-depth guide: Redshift ETL in 2018
Data Warehouse Security
When designing a data warehouse, you should consider the following for each data source:
- Does the data source require security or have audit/compliance restrictions?
- Who are the current users, and which of them should be authorized to see the data?
- What happens when new users are added to the system? Will they have access to the data by default, or does access need to explicitly granted?
The following data warehouse activities are affected by security requirements:
- User access—classify data according to its sensitivity, define user roles and assign permissions accordingly. It is common to classify users per department—for example, to allow only the finance department to access financial data. In other cases, data for different departments will be segregated and placed in completely separate data marts.
- Data movement—consider where sensitive data should be stored when loaded to the data warehouse, and who has access to the relevant disk space. When data is backed up, where is it stored and what is the security level of the backup media? When data is retrieved or exported by authorized personnel, where is it stored?
- Auditing—security and regulations impose a need to audit user and data activities in the data warehouse. This might include auditing connections, disconnections, access to data, modification, and deletion of data. It is highly important to audit both successful and failed operations—the latter can help identify unauthorized activity.
Documentation is an essential part of a security strategy. You must document the data classifications, user classifications, network and physical architecture, security requirements for data sources and data movements, and auditable actions in the data warehouse.
Data Warehouse Backup
Because the data warehouse is mission critical infrastructure, backup and disaster recovery are essential considerations. There are several models for backing up a data warehouse:
- Complete backup—backs up the entire data warehouse, including database files, control files, and journal files.
- Partial backup—for very large data warehouses, parts of the database can be backed up hourly or daily in a round-robin fashion, ensuring the entire data set is backed up after a few hours or a few days.
- Cold backup—done while the database is shut down. This type of backup is considered more reliable, but it requires downtime of at least one database replica.
- Hot backup—done while the database engine is up and running. Does not require runtime, but is considered less reliable.
- Hardware backup—done using storage appliances, dedicated backup disk drives, or tape storage.
- Software backup—backup is saved to storage devices in the data center, but these are not necessarily dedicated backup devices.
In modern cloud-based data warehouses, backup strategy is managed by the cloud service provider. For example:
- Amazon Redshift continuously backs up user data to Amazon S3. in addition, Redshift allows you to save snapshots of a data warehouse cluster and use them to restore the data warehouse from any point in time.
- Google BigQuery provides a managed export and import service which allows you to export data for offline processing, and recover accidentally deleted data. Data is stored to a Google Cloud Storage Bucket.
- Panoply automatically backs up changes to your data to redundant S3 storage, optionally saved in two Amazon availability zones across continents—enabling full recovery to any point in time.
The Future of the Data Warehouse
In recent years, the approach to data storage, organization, and analysis has undergone radical change. Traditional data warehouse vendors, including IBM, Microsoft, Oracle, SAP, and Teradata, are recognizing the competition from new data warehouse solutions in the cloud—from publicly traded companies such as Amazon and Google, to innovators like Panoply.
Cloud based data warehouses introduce better ways to extract information from data and analyze it. They make data warehousing accessible and effective not only for large and well-funded enterprises, but also small and medium businesses.
Instead of spending months and millions of dollars to setup a monolithic Enterprise Data Warehouse, it is now possible to set up a cloud-based data warehouse in days, starting from a few hundred dollars per month in managed services and cloud-based storage.
Furthermore, new technology is revolutionizing the data warehouse by accelerating routine tasks and reducing the repetitive, manual effort associated with each step of a data warehouse lifecycle. These next-gen data warehouses provide new ways to:
- Explore source data
- Prepare and optimize data
- Generate data models
- Create ETL or ELT pipelines on the fly
- Manage deployments
Generally, next-gen data warehouses enable easier maintenance and modification. They strengthen the quality and consistency of decision support infrastructures, and provide a timely response to changing business requirements, thus providing a huge benefit to the business team.
Most importantly, next-gen cloud data warehouses allow organizations to deliver data projects faster and with far fewer resources than traditional on-prem or classic cloud data warehouses—going from data to insights in days or even hours, instead of weeks or months.
Go in-depth:
- Read the blog post: Future of the Data Warehouse
- Get the whitepaper: The Evolution of the Data Warehouse
- Download the report: Data Warehouse Trends Report 2018
- Read about Panoply, the world’s first Cloud Data Platform