Quick answer:
BI and data warehousing still belong together for most teams that need trusted reporting across several sources and over time. Use a data warehouse or a lakehouse for that work; a small team with one or two sources can start with a BI tool on a read replica. Today, a warehouse can be pay-per-use and loaded with ELT, so getting started takes minutes, not months. Agreeing on metrics still takes longer.
For a long time, Business Intelligence and Data Warehousing were almost synonymous. You couldn’t do one without the other: for timely analysis of massive historical data, you had to organize, aggregate and summarize it in a specific format within a data warehouse.
But this dependency of BI on data warehouse infrastructure had a huge downside. Historically, data warehouses were or can be an expensive, scarce resource. They take months and millions of dollars to setup, and even when in place, they allow only very specific types of analysis. If you need to ask new questions or process new types of data, you are faced with major development efforts.
We’ll define business intelligence and data warehousing in a modern context, and raise the question of the importance of data warehouses in BI.
We’ll look at three current paths:
- A BI tool on a read replica or the operational database, enough for small teams with one or two data sources
- A cloud data warehouse with ELT, where raw data is loaded first and transformed in SQL inside the warehouse
- A data lakehouse, where BI tools query open tables in cloud object storage alongside machine learning workloads
What is Business Intelligence and Analytics?
Business intelligence (BI) is a process for analyzing data and deriving insights to help businesses make decisions. In an effective BI process, analysts and data scientists discover meaningful hypotheses and can answer them using available data.
For example, if management is asking “how do we improve conversion rate on the website?” BI can identify a possible cause for low conversion. The cause might be lack of engagement with website content. Within the BI system, analysts can demonstrate if engagement really is hurting conversion, and which content is the root cause.
The tools and technologies that make BI possible take data, stored in files, databases, data warehouses, or even on massive data lakes, and run queries against that data, typically in SQL format. Using the query results, they create reports, dashboards and visualizations to help extract insights from that data. Insights are used by executives, mid-management, and also employees in day-to-day operations for data-driven decisions.
What is a Data Warehouse?
A data warehouse is a relational database that aggregates structured data from across an entire organization. It pulls together data from multiple sources, much of it is typically online transaction processing (OLTP) data. The data warehouse selects, organizes and aggregates data for efficient comparison and analysis.
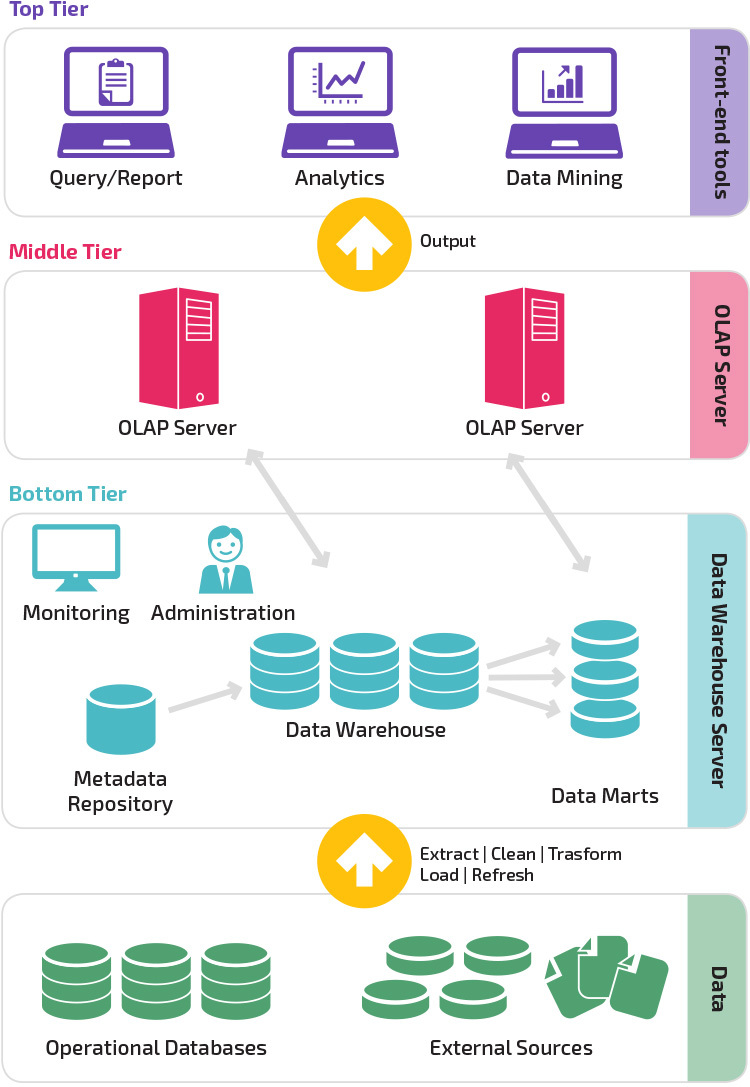
A data warehouse maintains strict accuracy and integrity using a process called Extract, Transform, Load (ETL), which loads data in batches, porting it into the data warehouse’s desired structure.
Accuracy and integrity require validation rules with both ETL and ELT.
Data warehouses provide a long-range view of data over time, focusing on data aggregation over transaction volume. The components of a data warehouse include online analytical processing (OLAP) engines to enable multi-dimensional queries against historical data.
Data warehouse applications integrate with BI tools like Tableau, Power BI, Looker and open-source options such as Metabase. They enable analysts using BI tools to explore the data in the data warehouse, design hypotheses, and answer them. Analysts can also leverage BI tools, and the data in the data warehouse, to create dashboards and periodic reports and keep track of key metrics.
When several BI tools read the same warehouse, a semantic layer such as dbt’s MetricFlow or Looker’s LookML defines each metric once. Dashboards using those definitions calculate revenue consistently, rather than rebuilding the calculation separately in each tool.
Business Intelligence and Data Warehousing: Can You Have One Without the Other?
Before data warehouses became standard, most organizations used decision support applications to make data-driven decisions. These apps queried and reported directly on data in transactional databases, without a data warehouse as an intermediary. This is similar to the current trend of storing masses of unstructured data in a data lake and querying it directly.
BI analyst Colin White, in his article “Is Data Warehousing Essential to Business Intelligence?”, lists five challenges experienced back in the days of decision support applications, without a data warehouse:
- Data was not usually in a suitable form for reporting
- Data often had quality issues
- Decision support processing put a strain on transactional databases and reduced performance
- Data was dispersed across many different systems
- There was a lack of historical information, because transactional OLTP databases were not built for this purpose
These, among others, were the reasons almost all enterprises adopted the data warehouse model. All five of these problems still seem relevant today. So can we do without a data warehouse, while still enabling efficient BI and reporting?
BI and ELT: Running in a Data Lake or Lakehouse without a Rigid ETL Process
With the advent of data lakes and technologies like Hadoop, many organizations are moving from a strict ETL process, in which data is prepared and loaded to a data warehouse, to a looser and more flexible process called Extract, Load, Transform (ELT).
ELT first took hold in Hadoop-era data lakes, which store masses of unstructured information. Today a data lake usually sits in cloud object storage such as Amazon S3, Google Cloud Storage or Azure Data Lake Storage, and open table formats such as Apache Iceberg and Delta Lake add tables, schemas and transactions on top of the files. Data is dumped to the data lake without much preparation or structure. Then, analysts identify relevant data, extract it from the data lake, transform it to suit their analysis, and explore them using BI tools.
The data lakehouse
A data lakehouse adds SQL, schemas, ACID transactions and governance to open tables on object storage, letting BI and machine learning share a copy of the data. Hadoop is the historical context here; current lakehouses use object storage and open table formats. Databricks built its lakehouse on Delta Lake; on June 4, 2024, it agreed to acquire Tabular, founded by Iceberg’s original creators, reportedly for over $1 billion. Its UniForm feature exposes Delta tables as Iceberg.
Snowflake’s Open Catalog for Iceberg reached general availability in October 2024. BigQuery manages Iceberg tables through BigLake, with core support generally available but some interoperability features still in preview. Amazon Redshift reads Iceberg tables and S3 Tables, and added UPDATE, DELETE and MERGE on Iceberg in April 2026.
Power BI and Tableau can query lake tables through a Databricks SQL warehouse without a separate warehouse copy. Power BI Direct Lake reads Delta tables in OneLake directly, but requires Fabric capacity. If most of your work is simple dashboards on small data, a lakehouse is more machinery than you need.
Does the Data Lake Replace the Data Warehouse?
ELT is a workflow that enables BI analysis while sidestepping the data warehouse. But those same organizations that use Hadoop or similar tools in an ELT paradigm, still have a data warehouse. They use it for critical business analysis on their central business metrics: finance, CRM, ERP, and so on.
Data warehouses are still needed for the same five reasons listed above. Raw data must be prepared and transformed to enable analysis on the most critical, structured business data. If management needs to see a weekly revenue dashboard, or an in-depth analysis on revenue across all business units, data needs to be organized and validated; it can’t be pieced together from a data lake.
Can such a structured analysis happen without a rigid ETL process? Or in other words, are ELT strategies relevant inside the data warehouse?
BI in a Cloud Data Warehouse with ELT
Yes, ELT now runs inside the warehouse. Pay-per-use options such as Snowflake, BigQuery and Amazon Redshift, alongside Databricks SQL on the lakehouse side, separate storage from compute. You can load raw data first and transform it in SQL when you need it. ELT does not require a lake or eliminate validation.
A managed or open-source loader such as Fivetran or Airbyte copies source tables in; dbt turns them into tested models that BI tools can query. Fivetran and dbt Labs have merged; dbt Core remains available.
Use this stack to address Colin White’s five challenges:
- Data not in suitable form for reporting: Source tables land in a raw schema; dbt staging models rename columns and cast types, then marts shape the data for analysts. The raw, staging and marts pattern keeps source data separate from reporting logic, so changing a dashboard does not require changing ingestion.
- Data has quality issues: dbt tests check key fields for missing values, uniqueness and accepted values with every build. In dbt’s 2025 State of Analytics Engineering survey, 56% of respondents named data quality a problem, so tests help detect and reduce problems rather than make source data automatically trustworthy.
- Strain on transactional database performance: Analytical queries run in a separate warehouse, while log-based change data capture reads the source database’s transaction log instead of running heavy reporting queries on production. The trade-off is freshness: warehouse data is often 15 minutes to 24 hours behind production, depending on the pipeline.
- Data dispersed across many systems: Managed loaders offer hundreds of prebuilt connectors for SaaS apps and databases, bringing Stripe, CRM and product data into the same destination. Cross-source analysis becomes a SQL join in one place, although you still need to model how records from different systems relate.
- Lack of historic information: Production databases often overwrite rows; warehouse models can preserve changes through snapshots and slowly changing dimensions, including dbt snapshots. Keeping those versions makes last quarter’s numbers reproducible, provided you capture the relevant changes rather than simply replace warehouse tables with the latest source state.
The primary benefit is shorter time to analysis. With a pay-per-use cloud warehouse and a managed loader, you can go from raw data to a first query in minutes or hours, instead of weeks to months. Modeling the data well still takes longer, but you can do it in small steps.
Tool picks are in the ETL Tools chapter, and the ETL Tutorial walks through the load-and-history recipes step by step.
Do You Need a Data Warehouse Yet? Signals by Stage
If BI queries slow product writes, start with a read replica, not a warehouse. Use the remaining signals to decide when BI and data warehousing belong together.
Stage 1: One or Two Sources, a Handful of People
A BI tool such as Metabase, Apache Superset or Power BI on the operational database or a read replica can be enough. Use a SELECT-only role, start with a statement timeout around 30 seconds, and expose reporting views that hide personal data.
Move to a read replica once dashboard load is steady. As a rule of thumb, it can buy six to twelve months by isolating query load, but it cannot join separate systems or recover history that production has overwritten. It does not consolidate scattered transformations either.
Stage 2: Three or More Warning Signals
Check which problems already affect your reporting:
- Analytics queries slow product writes.
- Questions join two or more systems, such as billing and CRM.
- Reports need historical snapshots.
- More than a few non-engineers write queries.
- Transformations are scattered across scripts, views and dashboards.
Three or more signals point toward a cloud warehouse with ELT; if only the first applies, start with a read replica. Compliance requirements and control over who can see particular columns also favor a warehouse with governed models.
Stage 3: Machine Learning and BI on the Same Data
A lakehouse fits when data science and BI need the same data, or when semi-structured events and logs arrive at volumes that are costly to copy into warehouse storage. It also fits when several engines need to read a shared copy through Iceberg or Delta tables. For a small team building simple dashboards, managing that architecture adds work without adding answers.
| Stage | Fits when | Breaks when |
|---|---|---|
| BI tool on the database or a replica | 1 to 2 sources, a few analysts, no history needs | Dashboards slow the app; cross-source joins become necessary; overwritten history cannot be recovered |
| Cloud warehouse with ELT | Cross-source reporting, shared metrics, historical snapshots and tested models | Heavy machine learning on raw files or very large semi-structured volumes makes copying data costly |
| Lakehouse | Machine learning and BI share a copy, with open formats and several query engines | A small team needs only simple dashboards, making the extra infrastructure over-engineering |
As of November 2026, check pricing pages before committing. BigQuery includes the first 1 TiB of queries and 10 GiB of storage free monthly, then charges $6.25 per TiB scanned on demand in the US multi-region. Redshift Serverless costs $0.375 per RPU-hour in US East (N. Virginia), making its 4-RPU minimum $1.50 an hour while active; eligible new Serverless accounts get a $300 credit that expires after 90 days.
Snowflake offers a 30-day trial. ClickHouse Cloud has no permanent free tier, but offers a $300 credit for a 30-day trial. Fivetran Free includes 500,000 monthly active rows; Airbyte open source is free to self-host, though you still pay for infrastructure and maintenance. For real bills, see the pricing playbook; Data Warehouses compares the options.
From Monolithic Data Warehouse to Agile Data Infrastructure
Data warehouses have come a long way. The monolithic Enterprise Data Warehouse (EDW), which required a multi-million dollar project to setup, and allowed only very limited BI analysis on specific types of structured data, is now the exception rather than the rule.
Today there are quick, low cost ways to get from raw data to business insights:
- BI tool on a read replica: The fastest start for one or two sources, until cross-source joins or historical reporting require more than a copy of production.
- Cloud data warehouse with ELT: The default once several sources and shared metrics matter; load raw tables, model them with dbt and pay for usage.
- Data lakehouse: Keep a shared copy of the data for BI and machine learning, using open table formats on object storage rather than separate analytical stores.
The slow-moving ETL dinosaur is not acceptable in today’s business environment. Organizations are saving money and making business decisions faster, by simplifying and streamlining the data preparation process.
Use the stage checklist above to choose the smallest architecture that solves your current reporting problems. Before moving, identify the reporting question your current setup cannot answer and the freshness it requires. Use that requirement to scope ingestion and models.
Common questions
Do Power BI and Tableau need a data warehouse?
No. Power BI and Tableau connect directly to databases, files and lakehouse SQL endpoints such as a Databricks SQL warehouse. Microsoft’s star schema guidance suggests adding a warehouse and ETL when Power Query transformations become difficult, especially with large volumes or slowly changing dimensions. A warehouse becomes worth it when several dashboards must agree on metrics across sources.
What is the difference between a database and a data warehouse for BI?
An operational database is built for transactions and often overwrites rows as they change; a warehouse supports analytical queries across sources and preserves history through appropriate models. Running BI on the operational database works at small scale. A warehouse takes over when query load, cross-source joins or historical reporting matter. See Database vs. Data Warehouse for the full comparison.
Data lake or data warehouse for BI?
Use prepared warehouse tables for trusted metrics or raw lake files for exploration. A lakehouse adds formats such as Iceberg and Delta so BI tools can query lake data with SQL. Raw lake files cannot underpin trusted metrics, while governed lakehouse tables with schemas, tests and access control can serve validated metrics without a separate warehouse copy. A data mart is a subject-focused slice of a warehouse; see Data Mart vs. Data Warehouse.
How long does it take to set up a cloud data warehouse?
A first query can take minutes on BigQuery, Snowflake or Redshift Serverless; connecting sources with a managed loader can take hours. Those are starting points, not a finished reporting system. Modeling the data, adding tests and agreeing on metric definitions can take weeks. Start with a reporting question you already need answered, then expand the models as requirements become clear.
What does a small data warehouse cost?
A small BigQuery workload can cost nothing within its monthly allowance of 1 TiB of queries and 10 GiB of storage; additional on-demand queries cost $6.25 per TiB in the US multi-region. Redshift Serverless’s 4-RPU minimum costs $1.50 an hour while active in US East (N. Virginia), excluding storage. Set query limits and billing alerts to control costs. Budget separately for ingestion and transformation; the pricing playbook above models fuller bills.
Where to next
For deployment choices, see Data Warehouse Architecture: Traditional vs. Cloud. For storage roles, see Database vs. Data Warehouse and Data Mart vs. Data Warehouse. For an AWS-specific explanation, see Amazon Redshift Architecture. For implementation approaches once you have chosen your destination, see 3 Ways to Build an ETL Process.
Snowflake, BigQuery, Redshift, Databricks, Fivetran, Airbyte and the rest, with pricing and what each one replaces.
Browse the tools