
Shopify Data Model Explained | How Shopify's Data is Structured
If you sync all your Shopify data to Panoply, you’ll have access to an array of data about customers, products, orders, transactions, refunds, your Shopify Collections, and more.
That’s a whole lot of data to explore, with even more game-changing insights to discover. But before you start, you’ll need to know how Panoply transforms your Shopify data into query-ready tables. To understand what’s going on, you should be acquainted with:
- Nested data structures
- The Shopify data model
- Panoply’s table structure
Nested Data Structures
Nested data structures have at least two levels of data in a parent-child relationship. Each element is a parent, a child, or both…in which case we’re talking about a multilevel nested data structure.

“Multilevel nested data structure” is a mouthful, but the concept isn’t hard to understand. Just think of it as a piece of data’s family tree—everything is related, but the relationships may be more or less distant (and complicated!) depending how far down the branches you go.
Not sure what a family tree has to do with your Shopify store? That same nested structure comes into play every time you make a sale. Take a look:

While a customer might purchase items separately, they’re just as likely to put multiple items in their shopping cart and purchase them all as a single order.
Now that you’ve got the basics of nested data down, let’s take a deeper look at Shopify’s nested data model.
The Shopify Data Model
To understand Shopify’s data model, let’s explore a store that sells paintings using Shopify Collections.
The figure below illustrates the Collections API. You can see here how collections are organized at the parent level of a nested data structure. Only three fields are displayed:
- The image
- The title
- The conditions the products must match
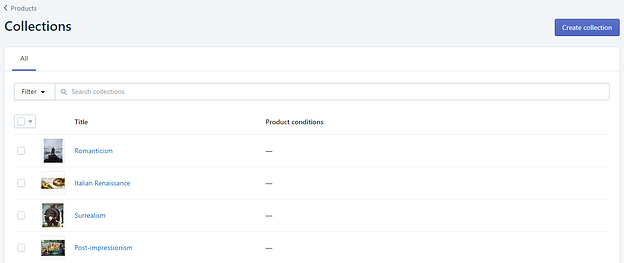
A visual representation of the Shopify Collections API.
Shopify distinguishes between two types of Collections: automatic and manually created ones. However, the list above doesn’t tell you which is which.
If you click on a Collection, a window will open with more details.
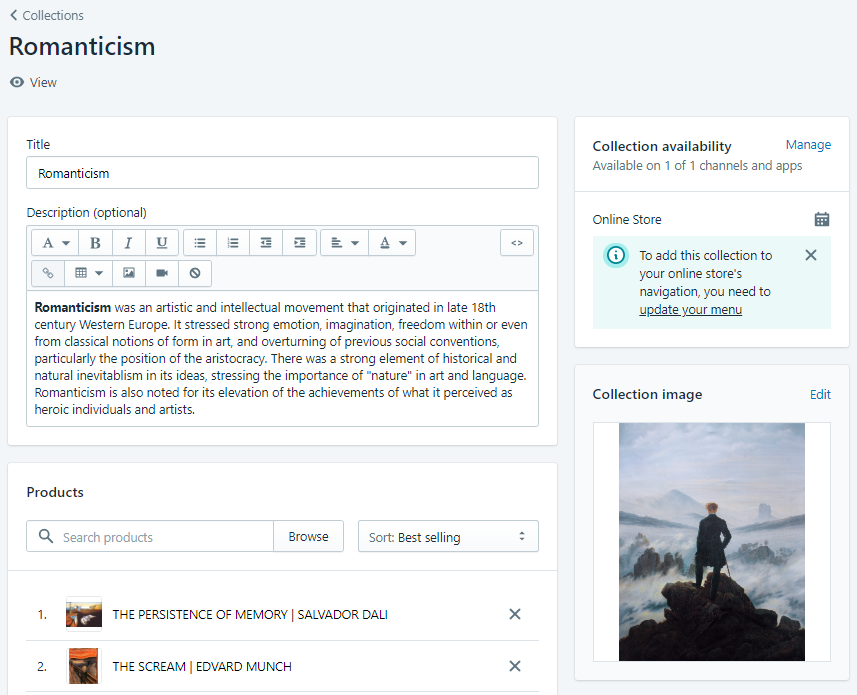
Details associated with a Shopify Collection.
Along with data related to the Collection itself—such as the description and availability—you can see which products belong to the Collection and how they’re sorted (in this case, by best selling).
In terms of child data, take a look at the Collection image. If you click it, you’ll see a brief description of the image. This is an example of child data within a nested data structure.
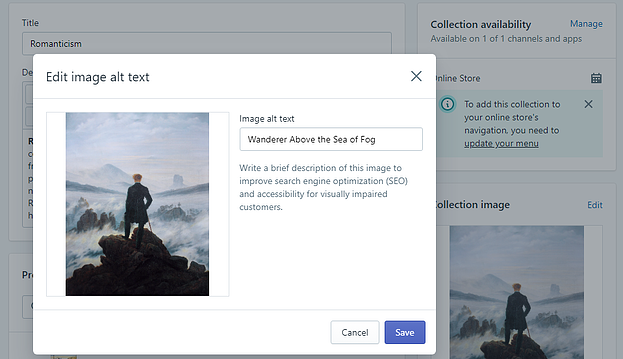
The Collection image has child data in the form of image alt text, or a brief description of the image.
When you put it all together, this is how Shopify organizes your Collections data into a nested structure:


The details you see on the screen in a Shopify Collection are actually part of a nested data structure that’s used behind-the-scenes to power your shop.
Keep this figure in mind: it will help you understand the transformation that happens to your Shopify data as it’s synced to Panoply.
Panoply Data Structure
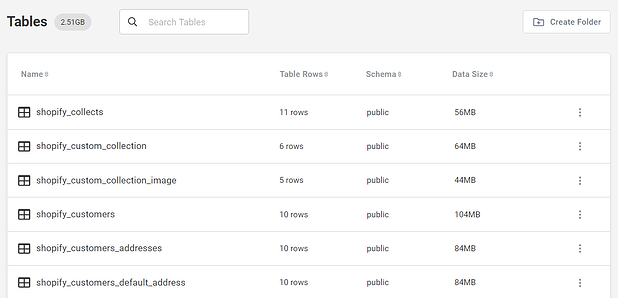
When you sync your Shopify data to Panoply, it’s automatically stored in query-ready tables that you can find in the Tables tab.
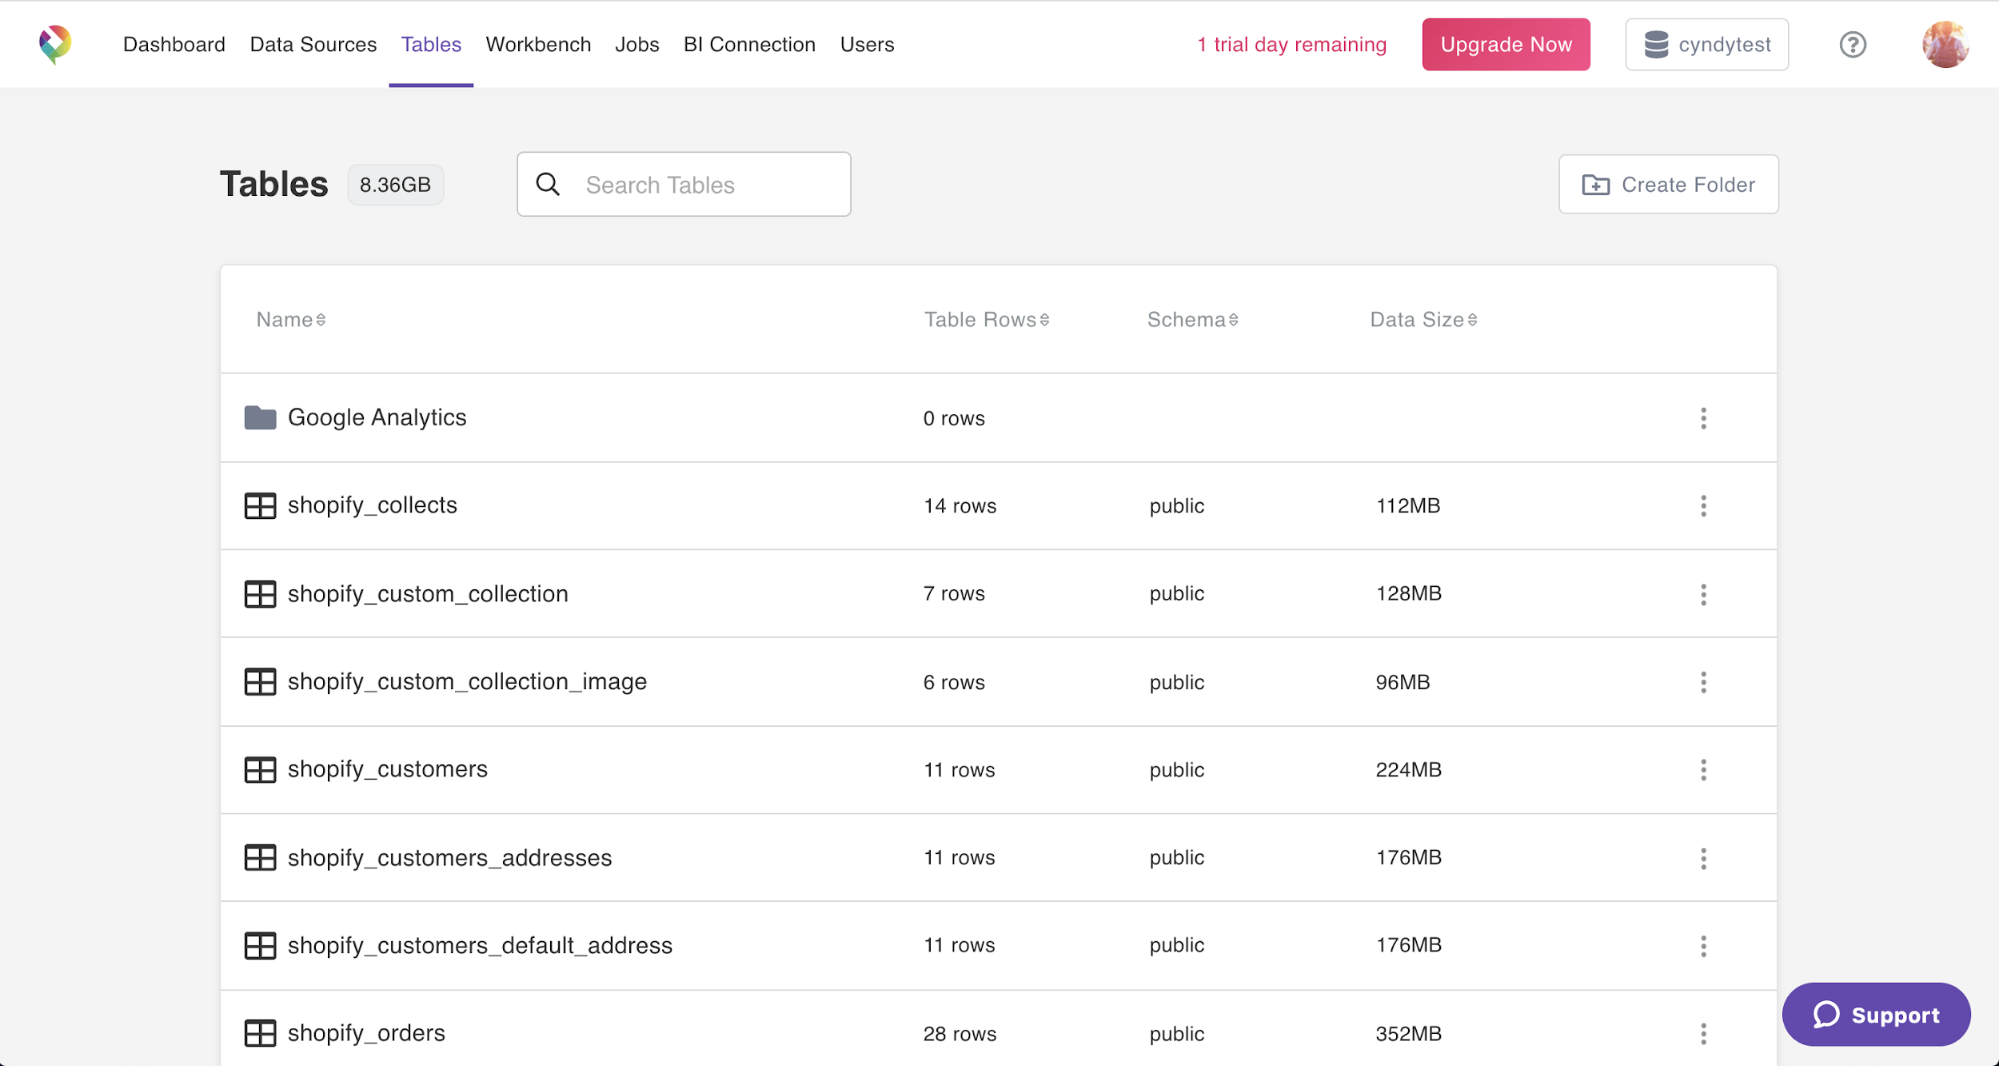
Automatically created tables of Shopify data synced to Panoply.
It may seem like Panoply creates a lot of tables, but they all fall into 8 logical groupings:
- Collects
- Custom Collection - manually created Shopify Collections
- Customers
- Orders
- Products
- Refunds
- Smart Collection - automatically created Shopify Collections
- Transactions
Each of these logical groupings contain at least one parent table. There may also be one or more optional child tables. To distinguish between them, you need to understand Panoply’s table naming conventions.
Panoply’s Table Naming Conventions
When naming tables, Panoply uses a clear and consistent set of conventions that starts with the data source name and then includes nested data information. The general formula is:

If we think back to the family tree, Panoply’s table naming would look like:

Instead of maintaining a nested hierarchy, Panoply turns synced data into a “flattened” table.
Now that you have a sense of how the naming conventions work, let’s break down those Panoply tables:
The data source is Shopify, so all tables have a shopify prefix.
If you know how Panoply creates logical groupings of Shopify data, you can easily identify the parent tables. Just put the grouping name in place of the parent_group_name:
shopify_collectsshopify_custom_collectionshopify_customersshopify_ordersshopify_productsshopify_refundsshopify_smart_collectionshopify_transactions
All the tables that aren’t listed above are child tables. They can be easily connected with their parent table because they share the same data_source and parent_group_name.
For example, if you want to identify all child tables related to the parent orders, just search for tables with names that contain “orders.”
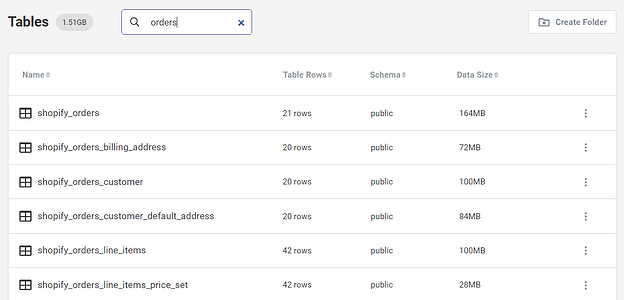
Searching for “orders” in the Tables tab brings up both parent and child tables for Shopify orders.
The first table in the results is the parent table. All the other tables are child tables containing various details regarding the orders. Let’s see how those fit together in the shopify_orders family tree:

Panoply transforms the Shopify nested data structure shown above into easily queryable flattened data.
Why do Panoply and Shopify structure data differently? The answer has to do with how Shopify packages data for exports through its API. Shopify exports data in JSON files, a standard form of nested data that’s great for large data sets but that doesn’t play well with most BI tools. To make your data query-ready, Panoply transforms nested data into a flat relational model ready for use by your favorite analytical tools.
Panoply Table Structure
When you open a newly-created table in Panoply, you might see some columns you didn’t expect:
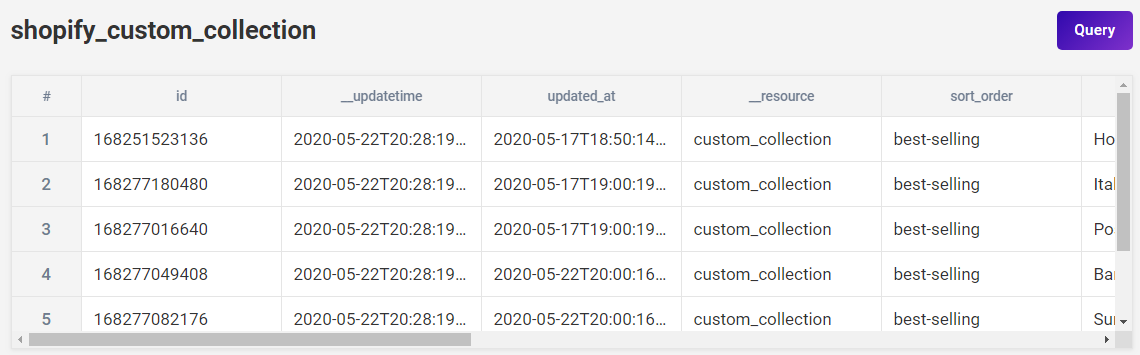
That’s not a mistake. Panoply automatically generates a key—that is, a unique id that you can use to join tables together in SQL—for every table it creates. The key column is always named “id.”
Panoply also adds auto-created metadata columns when your data is synced. However, those columns don’t contain metadata about the table itself, but about the data source the table was created from, its state, and the data transaction process.
You can easily identify these metadata columns because their name starts with __. Each Panoply table contains the same four metadata columns:
updatetimeresourcestatesenttime
Below your Panoply table, you’ll find a section on metadata. This section provides additional information about the type of data found in the columns of your table. To see all the details about the metadata associated with your table, or to update the data type in a particular column, click the downward carat on the right.
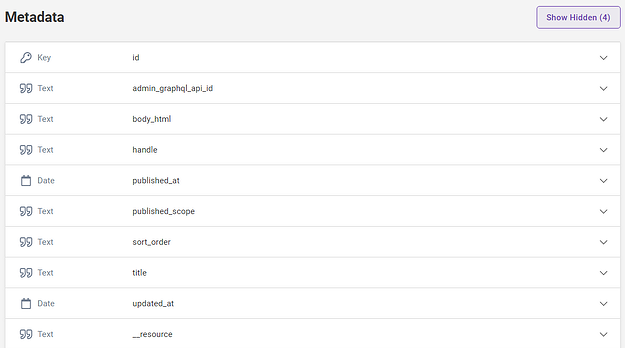
The metadata section provides useful information about the types of data in your table. By default, Panoply-created metadata columns whose names begin with __ are hidden.
Joining Parent and Child Tables
As in any relational data model, the relationship between parent and child tables in Panoply is based on keys. To join tables, Panoply automatically creates a column within each child table that contains the same value as the parent table’s key column.
Panoply uses a consistent naming convention for these columns: [parent_table_name]_[id].
If you look at the Custom Collections data group, you’ll see a parent table called shopify_custom_collection and one child table named shopify_custom_collection_image. To join the two tables, you’ll need to use a column in the child table named shopify_custom_collection_id. Here’s what that would look like:

Panoply automatically creates a key column within each child table to make it easier to create joins.
To join the two tables seen in the figure above, just enter the following script into the Panoply workbench or an analytics or BI tool.
SELECT scc.id AS collection_id,
	scc.title,
	scc_i.id AS collection_image_id,
	scc_i.height AS collection_image_height,
	scc_i.width AS collection_image_width
FROM shopify_custom_collection scc
JOIN shopify_custom_collection_image scc_i ON scc.id = scc_i.shopify_custom_collection_id
ORDER BY scc.title
Data Mapping from Shopify to Panoply
Remember that figure from the beginning that showed how nested data is represented in the Shopify API?
When it comes to how data is handled, there’s always a lot going on under the surface.
Let’s build on that to understand how Shopify data is mapped into a Panoply data warehouse. The data from Shopify is the same, but now you’re now seeing how Panoply handles that nested data:
Panoply turns nested Shopify data into parent and child tables that are connected via an id column.
As you can see, there are some columns that aren’t visible in the Shopify API but are reflected in Panoply’s shopify_custom_collection_image table, such as image_id, url, height, and width.
Likewise, there could be some columns in Shopify that Panoply ignores because they aren’t helpful for reporting or insights. An example is the Collections’ availability: this information isn’t present at the parent or child tables in Panoply.
Exploring Your Shopify Data in Panoply
To get started, click the Workbench tab. The left sidebar shows a preview of the tables and views available within your Panoply public schema.
Note: By default, tables are created in Panoply’s public schema. If desired, you can create custom schemas for your data.
The sidebar on the left provides a preview of the tables and views within the public schema. If you open a table, you’ll see that each column within that table has the following information:
- An icon indicating its data type (on the left)
- The column name
- The data type name (on the right)

The Workbench tab is where you can query your data within Panoply. Just add SQL to get started.
In this panel, you can run queries by entering SQL and clicking Run or hitting Shift+Enter. Use the buttons along the top to:
- Open existing views
- Save changes to your current view
- Save As to turn a SQL query into a new view
- Export query results as a CSV file
- Delete the current view
There are no automatically created views in Panoply. This is because views are best defined based on your internal business logic so that they accurately reflect your business context and needs.
Want to see how all that data comes together? Get the SQL you need to run an RFM report or find your most valuable customers!