
Advanced Analytics and Reporting for Shopify

This tutorial features SQL queries written in Redshift SQL syntax. If you’re on a Google BigQuery data warehouse, work with one of our data architects to adjust these queries to work in standard SQL syntax.
You’ve perfected your Shopify store, you’ve put together a strategic marketing mix, and you’ve got a steady stream of sales coming in. You’re on the road to retail genius—and for good reason.
But if all that success also means that you find yourself:
- spending hours on your regular reporting each week…
- cobbling together data from all over the company via a brittle chain of spreadsheets…
- or just plain frustrated by a lack of visibility around your customers, orders, or inventory…
You are not alone. For many Shopify merchants, growth isn’t just a sign of success, it’s a problem to manage. But it shouldn’t be. By harnessing your Shopify data, you can make better business decisions more easily—and you don’t need an entire analytics team or an expensive consulting firm to do it.
In this guide, you’ll learn:
Why aren’t built-in Shopify reports good enough?
Shopify dashboards are great when you’re starting out, but they can only take you so far. For example, Shopify’s built-in reporting won’t let you answer a question like, “Which of my customers are the most valuable?”
If you’ve ever taken advantage of a $5-off coupon for a $6 item only to never return to that store again, you can see the importance of this kind of information. By identifying your most valuable customers, you can target your marketing and promotional efforts in a way that will encourage them to spend even more with you without subsidizing deal seekers who’ll only buy when your margins are at their thinnest.
Plus, Shopify’s standard reporting doesn’t give you a competitive edge. Those prepackaged dashboards are available to thousands of other Shopify merchants, which means they’re all basing their strategy around the same stock insights.
Can’t I just hook Shopify to a BI tool like Tableau?
Just because you can doesn’t mean you should. The problem with connecting Shopify directly to your business intelligence tool is that while it might give you prettier visuals than the native Shopify reporting, it doesn’t actually offer more insight.
That’s because you’d still be looking at Shopify data in isolation rather than taking advantage of multiple data sources to really understand your customers, sales, and inventory. Adam Beltz, Senior Manager of Information Architecture at Matilda Jane, a Shopify merchant that creates whimsical girls clothing, explains:
“Before Panoply, we had spreadsheets on spreadsheets and random transaction reporting tools all cobbled together.”
By using a tool like Panoply, you can sync all your data—including sources like Google Analytics, Facebook Ads, Zendesk, and QuickBooks—for a much more cohesive and meaningful view of your business. Plus, you’ll finally be working from a single source of truth (SSOT) that your entire company can trust.
For more on the benefits of centralizing your Shopify data and blending it with other sources, check out our on-demand webinar on Measuring Black Friday and Cyber Monday for Shopify.
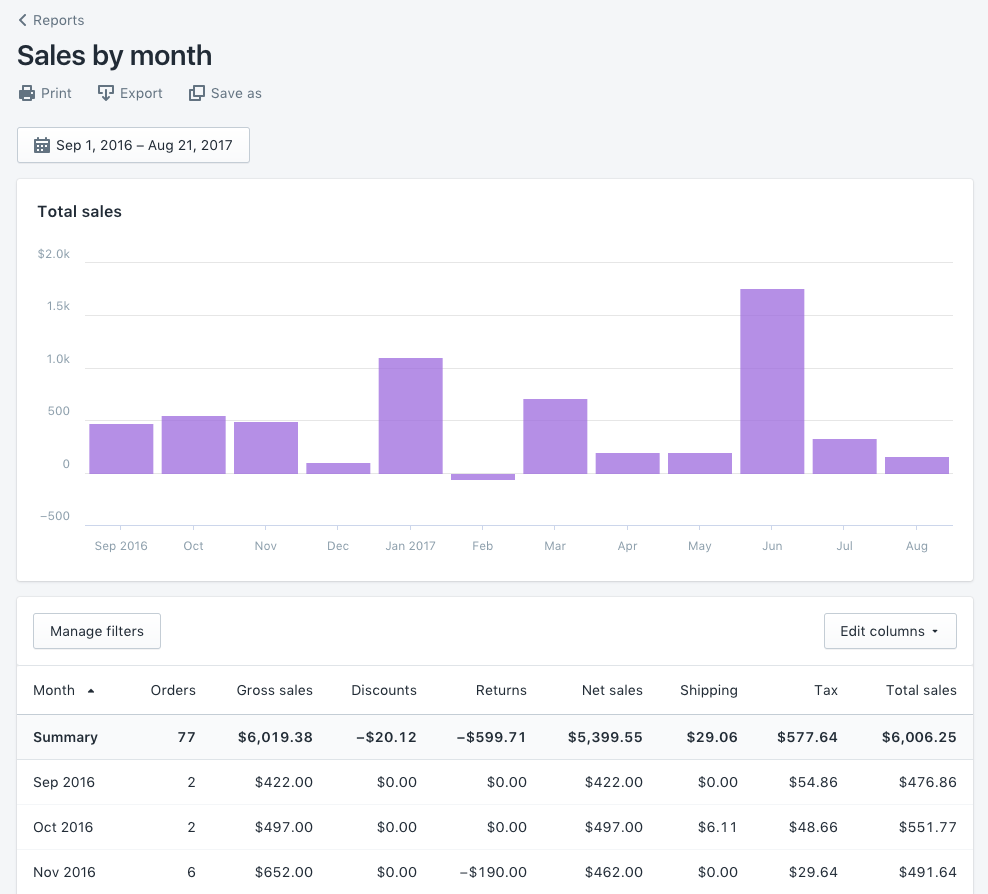
How to Create a Shopify Sales Over Time Report
Once your data is in Panoply, a whole new world of insights is at your fingertips. Whether you’re already familiar with or have been longing for Shopify’s Sales Over Time report, it’s incredibly helpful for gauging the health of your sales as well as identifying seasonal trends.
To get a taste of this report in Panoply, just head to the workbench and paste in this SQL query:
    /* BASIC SHOPIFY GROSS SALES BY MONTH */
    SELECT date_trunc('month', o.created_at) AS "month",
    	count(o.id) AS total_orders,
    	sum(o.total_line_items_price) AS gross_sales,
    	sum(-o.total_discounts) AS discounts,
    	sum(o.total_tax) AS total_tax
    FROM shopify_orders o
    GROUP BY 1
    ORDER BY 1;
This example query will return three key metrics:
total_orders= the count of ordersgross_sales= sum of gross salesdiscounts= sum of discounts
| # | month | total_orders | gross_sales | discounts |
|---|---|---|---|---|
| 1 | 2020-07-01T00:00:00.000Z | 45 | 28053.01 | -2213.76 |
| 2 | 2020-08-01T00:00:00.000Z | 42 | 25687.44 | -2532.0 |
| 3 | 2020-09-01T00:00:00.000Z | 28 | 15096.56 | -1047.0 |
In this example, the GROUP BY function lets us see a rollup by month, but you can adjust that to show daily, weekly, quarterly, or even yearly data.
Syncing Shopify data to Panoply is seamless, but there’s a lot going on behind the scenes. To really understand what’s happening in these queries, get a deep dive into how data is structured in Shopify and Panoply.
Now that you have a sense of how queries work in Panoply, let’s replicate the complete Sales Over Time report. To calculate the metrics the way Shopify does, you’ll need to join a few more tables into the query.
To get started, copy this SQL query and paste it into your workbench:
    /* SHOPIFY SALES REPORT BY MONTH */
    SELECT date_trunc('month', o.created_at) AS "month",
    	/* Standard metrics */
    	count(o.id) AS total_orders,
    	sum(o.total_line_items_price) AS gross_sales,
    	sum(-o.total_discounts) AS discounts,
    	sum(-nvl(r.refunds,0)) AS "returns",
    	gross_sales + discounts + "returns" AS net_sales,
    	sum(o.total_tax) - sum(nvl(r.tax_returned,0)) AS taxes,
    	sum(nvl(sl.shipping_charge,0)) AS shipping_cost,
    	gross_sales + discounts + "returns" + taxes + shipping_cost AS total_sales,
    	/* Additional metrics */
    	sum(nvl(li.number_of_items_sold,0)) - sum(nvl(r.number_of_items_returned,0)) AS net_quantity,
    	round(net_quantity::FLOAT / total_orders, 2) AS units_per_transaction,
    	round(sum(o.total_price) / count(o.id), 2) AS average_order_value
    FROM shopify_orders o
    LEFT JOIN (
    	/* LINE ITEMS TABLE */
    	SELECT li.shopify_orders_id,
    		sum(lipsm.amount * li.quantity) gross_price,
    		count(li.id) AS number_of_items_sold,
    		sum(li.total_discount) AS line_item_discount
    	FROM shopify_orders_line_items li
    	LEFT JOIN shopify_orders_line_items_price_set lips ON li.id = lips.shopify_orders_line_items_id
    	LEFT JOIN shopify_orders_line_items_price_set_shop_money lipsm ON lips.id = lipsm.shopify_orders_line_items_price_set_id
    	GROUP BY 1
    	) li ON o.id = li.shopify_orders_id
    LEFT JOIN (
    	/* REFUNDS TABLE */
    	SELECT r.shopify_orders_id,
    		count(r.id) number_of_items_returned,
    		sum(rli.subtotal) AS refunds,
    		sum(rli.total_tax) tax_returned
    	FROM shopify_orders_refunds r
    	LEFT JOIN shopify_orders_refunds_refund_line_items rli ON r.id = rli.shopify_orders_refunds_id
    	GROUP BY 1
    	) r ON o.id = r.shopify_orders_id
    LEFT JOIN (
    	/* SHIPPING LINES TABLE */
    	SELECT sl.shopify_orders_id,
    		sum(sl.price) shipping_charge,
    		sum(sl.discounted_price) shipping_discount
    	FROM shopify_orders_shipping_lines sl
    	GROUP BY 1
    	) sl ON o.id = sl.shopify_orders_id
    GROUP BY 1
    ORDER BY 1;
This query pulls information from several tables to return a whole lot more data, including details like returns, net sales, and shipping. To keep it simple, let’s take a look at one row from that table to get a sense of what you’d see:
| # | month | total_orders | gross_sales | discounts | returns | net_sales | taxes | shipping_cost | total_sales | net_quantity | units_per_transaction | average_order_value |
|---|---|---|---|---|---|---|---|---|---|---|---|---|
| 1 | 2020-09-01T00:00:00.000Z | 28 | 15096.56 | -1047.5 | -700 | 13636.6 | 514.26 | 186.2 | 14337.06 | 51 | 1.82 | 539.16 |
Exploring this report can give you key insights into your business, from your average order size to how many returns you receive each month.
Ready to try Panoply? Get started now with a Free 21-Day Proof of Value. Setup only takes a few minutes and once your data is synced, you can pull your own Sales Over Time report right in Panoply!