Editor’s note: This Pantomath review is based on my hands-on test of Pantomath’s Data Operations Center in November 2026. I weighed pricing and contract terms, setup and connectors, traceability and monitors, incident management and AI agents, security and vendor stability against Monte Carlo, Acceldata, IBM Databand, Sifflet and Metaplane.
Quick verdict: I recommend Pantomath for enterprise data operations teams whose pipelines cross several orchestration, ETL and BI tools (Control-M, Informatica, Azure Data Factory, Databricks, Power BI) and who want to trace a failed job to the dashboard it breaks and open the ticket automatically. The only public price is a $250,000 12-month contract on AWS Marketplace, there is no free trial, and the AI agents recommend fixes for a person to approve.
The strongest result in my Pantomath review was lineage that joins job execution with data flow across 58 integrations, turning a failure into one correlated incident with a ServiceNow or Jira ticket. Metaplane monitors per warehouse table, while Pantomath starts from the failed job; Monte Carlo, now with Azure Data Factory, Informatica and Databricks Workflows lineage, is its closest rival.
In this review, I’ll take a closer look at Pantomath’s pricing, features, and AI agents, so you can see exactly whether it belongs in your data stack or whether a cheaper data observability tool covers what you need.
Key Takeaways
- Cross-platform traceability: Auto-discovered lineage joins job execution with data transformations, upstream and downstream.
- Legacy-friendly connectors: 58 integrations in 13 categories, including Control-M, Informatica, IBM DataStage and SSIS.
- Recommend-stage AI: A Triage Agent routes incidents to nine specialist agents or a generalist; a person approves every fix.
- Enterprise-only price: $250,000 for 12 months on AWS Marketplace, plus $0.01 per metered unit, with non-cancellable fees.
- No trial, no public setup guide: Connection method, credentials and per-connector setup steps are not published.
Pros and Cons
Pros
- Lineage joins job execution flow with data flow across 58 integrations.
- Six auto-configured monitors cover job health and dataset quality.
- Auto-created ServiceNow or Jira tickets carry lineage, telemetry and a root-cause hypothesis.
- Legacy coverage includes Control-M, Informatica, IBM DataStage, SSIS and SAP BusinessObjects.
- A Triage Agent and nine specialist agents write lineage-based resolution plans.
Cons
- The only public price is $250,000 for a 12-month contract on AWS Marketplace.
- Metered usage costs $0.01 per unit on top, with no public unit definition.
- No free trial, sandbox or public connector setup guide.
- The Resolve stage is marked coming soon; autonomous resolution is still with design partners.
- SaaS only, with no published self-hosted or VPC option, unlike Sifflet and Acceldata.
Pantomath Pricing: How Much Does It Cost?
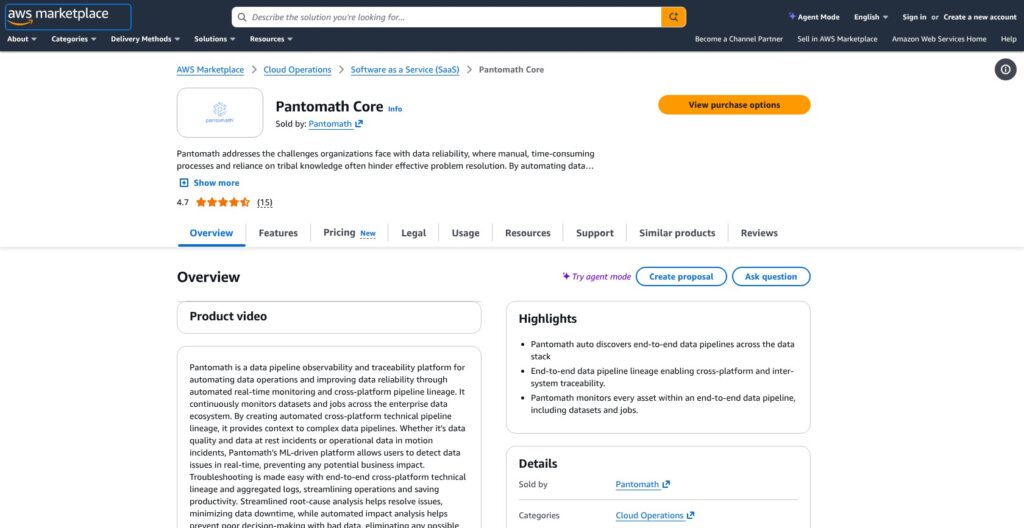
Pantomath shows no prices on its own site. The only public figure is on AWS Marketplace, where the Core Platform costs $250,000 for a 12-month contract, with metered usage billed on top.
- Core Platform, 12 months ($250,000): for enterprises buying through AWS Marketplace; pay upfront or in installments, delivered as SaaS rather than deployed in your AWS account.
- Core Platform, 24 or 36 months (price not shown): for teams that want a longer term; AWS Marketplace offers both terms without a public price.
- Metered usage ($0.01 per unit): billed on top of the contract as usage grows with monitored jobs, datasets and connected platforms; the unit is not defined publicly.
- Snowflake Marketplace (paid with Snowflake credits): for Snowflake customers who want to buy against their Snowflake spend; no price is shown, and Sifflet and Metaplane accept Snowflake credits too.
- Direct contract (quote): for buyers who procure outside AWS or Snowflake, through a demo request with Pantomath sales.
| Option | Term | Price | Billing |
|---|---|---|---|
| Core Platform, AWS Marketplace | 12 months | $250,000 | Upfront or installments |
| Core Platform, AWS Marketplace | 24 or 36 months | Quote | Upfront or installments |
| Metered usage | Per unit | $0.01 | On top of contract |
| Snowflake Marketplace | Contract | Quote | Snowflake credits |
| Direct | Contract | Quote | Per contract |
The $250,000 is a floor, not an all-in budget: with no public definition of a usage unit, there is no way to forecast what the $0.01 dimension adds across a large estate of jobs, datasets and platforms. Until Pantomath defines the unit, budget the contract plus a separate overage line.
Is Pantomath Good Value for Money?
- Only for cross-tool failures: Metaplane has a free tier for 10 tables and per-table paid plans, so Pantomath earns its price only when the problem is job failures spreading across several tools, not table anomalies.
- A known anchor against Monte Carlo: Monte Carlo publishes no per-credit price for its Start, Scale, Enterprise and Business Critical tiers, so Pantomath’s $250,000 figure is at least a public reference point for negotiation.
- Overkill for dbt-only teams: Elementary’s open-source dbt package is self-hostable, which covers a dbt-centric stack without an enterprise contract.
- Start with 12 months: AWS fees are non-cancellable and non-refundable except as required by law, so the 12-month term is the safe first commitment.
Reviewer’s Notes: I recommend starting on the 12-month Core Platform term and getting the metered usage unit, plus what counts as a job, a dataset and a connected platform, defined in writing before signing. Consider 24 or 36 months only after a year of invoices shows what the $0.01 dimension adds on top of the $250,000.
My Experience With Pantomath
Pantomath has no free trial, sandbox or self-serve signup, so my access started with a demo request through its form, with sales@pantomath.com as the alternative route. IBM Databand, by contrast, lets you start on a free trial, and Metaplane has a free tier for 10 tables.
Getting Access and Connecting My Stack
Pantomath publishes no setup guide, so after my demo request the connection method, required credentials and per-connector setup steps came from Pantomath during onboarding. That puts every permissions question from a security team into the sales cycle. Elementary Cloud, by comparison, states its access up front: read access to its metadata schema only.
I connected four tools:
- Azure Data Factory: the upstream ingestion jobs that feed Databricks.
- Databricks: Workflows, Tasks and DLT pipelines, supported on AWS and Azure workspaces.
- Snowflake: a Connected App, the same one sold on Snowflake Marketplace, that kept Pantomath’s metadata inside my own Snowflake account.
- Power BI: the downstream report refreshes.
I signed in through SSO, which supports Okta, Azure Active Directory, Google Workspace, Auth0, OpenID and SAML.
The Data Operations Center
The Data Operations Center was my home screen: one dashboard summarizing platforms, pipelines, assets, incidents and SLA metrics. Its six monitors are auto-configured across jobs and datasets alike, so I wrote no checks by hand, unlike with Great Expectations or Soda.
Lineage Explorer, which Pantomath rebuilt in May 2026 with a new renderer, data layer and layout engine, showed job execution steps and data transformations in one view, traced upstream to causes and downstream to affected assets.
Following One Failure From Alert to Ticket
The chain I traced started with an Azure Data Factory job feeding Databricks datasets, continued with a Databricks job transforming them, and ended with a Power BI refresh consuming the result.
When the upstream Azure Data Factory job failed, Pantomath correlated the related events (logs, metrics and lineage) into one incident instead of firing separate alerts from each tool. It auto-created a ticket (ServiceNow and Jira are both supported, bi-directionally), pre-filled with lineage, telemetry and a root-cause hypothesis. It then routed the ticket to the engineer named in the RACI matrix I had defined, sent a Slack or Teams notification, and tracked SLA adherence in the system of record.
The Triage Agent passed the incident to one of its nine specialist agents, which returned observations, the root cause, an impact analysis across the downstream Databricks and Power BI assets, and a step-by-step resolution plan with code snippets and commands. I approved and carried out the plan myself, because Pantomath’s agents stop at the Recommend stage.
Reviewer’s Notes: With no trial available, I recommend asking Pantomath to run the demo on a copy of your own failure chain, spanning an orchestrator, a warehouse and a BI tool, rather than on its sample data, because Pantomath publishes no accuracy figures for its agents. Get the connector credentials and permissions list in writing before your security review starts.
Cross-Platform Traceability and Monitoring
Pantomath combines data lineage with job lineage, putting transformations and execution flow in one auto-discovered view. A stale Power BI report therefore traces back to the Azure Data Factory or Apache Airflow job that ran late, not just to the table feeding the report.
Job Lineage Plus Data Lineage
Pantomath’s name for this is Unified, Cross-Platform Traceability: it auto-discovers dependencies across upstream tools such as Airflow, Fivetran and dbt, traces upstream for root cause and downstream for impact, and publishes its lineage into Snowsight for Snowflake users.
Pantomath does not publish whether its lineage reaches column level, and its connection method (agents, APIs or logs) is not public either. For an incident process that depends on column-level impact, that is the first question for the demo.
Monte Carlo has added Azure Data Factory, Informatica and Databricks Workflows observability with multi-system lineage, so cross-tool job lineage is no longer exclusive to Pantomath. Compare the two on your own schedulers and ETL tools: Pantomath’s list includes Control-M, SSIS and IBM DataStage.
What Pantomath Monitors
- Job failures: failed job runs, caught in real time.
- Job latency: jobs running longer than expected because of resource contention or volume spikes.
- Skipped jobs: jobs that never start at their scheduled time.
- Data volume: missing rows and unexpected zero-record files.
- Data freshness: datasets that are no longer current.
- Field-level data quality: embedded quality checks on individual fields.
Pantomath groups jobs, pipelines, stored procedures, workflows and DAGs as data in motion and datasets as data at rest. I rated the skipped-job monitor highest: a job that never starts throws no failure, so failure alerts alone miss it.
Snowflake and Databricks Depth
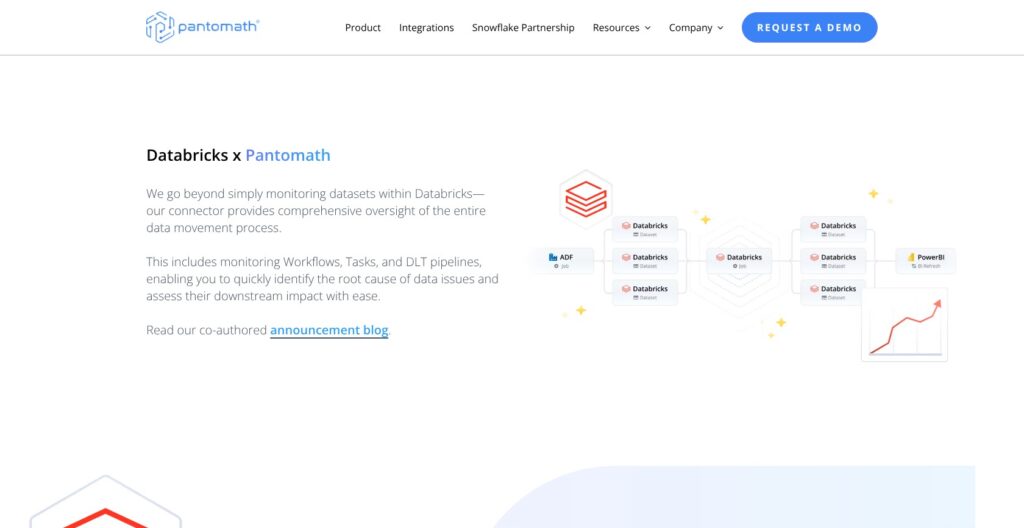
Snowflake Data Quality data metric functions (DMFs) run on Snowflake compute and sync into Pantomath’s incident framework, so warehouse quality checks land in the same incident workflow as job failures. Databricks Workflows, Tasks and DLT pipelines are monitored on AWS and Azure only. Pantomath carries Snowflake Ready Technology Validation and is a validated Databricks technology partner.
Best for: multi-tool pipelines where execution and data dependencies must be traced together. Skip if: your stack is dbt plus one warehouse, where Metaplane’s free 10-table tier or Elementary’s open-source package is the cheaper start.
Incident Management and AI Agents
Pantomath auto-creates a ticket for each correlated incident, fills it with lineage, telemetry and a root-cause hypothesis, and routes it through a customer-defined RACI matrix to the right data reliability engineer or data engineer. Correlation merges logs, metrics and lineage events into that single incident, so one upstream failure raises one alert instead of many.
Tickets, Routing and SLAs
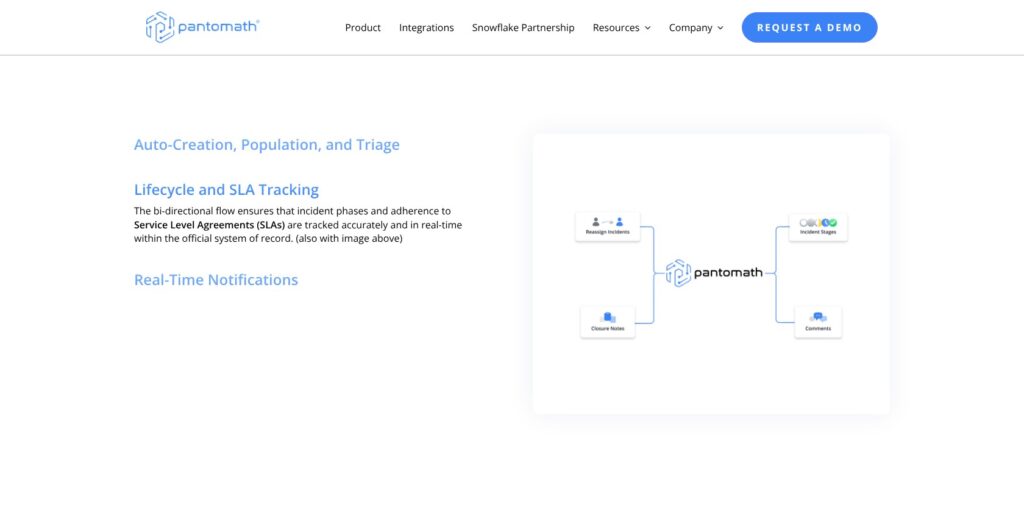
The ServiceNow and Jira integrations are bi-directional, and ticket actions cover reassigning incidents, moving them through incident stages, adding comments and writing closure notes. SLA adherence is tracked in real time in the system of record, and notifications go to Slack, Microsoft Teams, PagerDuty, Google Chat and email.
IBM Databand alerts on run duration, counts and freshness SLAs through Slack, PagerDuty and email. Pantomath automatically writes and routes the ServiceNow or Jira ticket, which suits teams where ServiceNow or Jira already governs incident ownership.
The Triage Agent and Nine Specialists
Since June 2026, a Triage Agent routes each incident to one of nine specialist agents, or to a generalist when no specialist matches:
- Access
- Code/SQL
- Schema conflicts
- Resource exhaustion
- Infrastructure
- Network/connectivity
- Ingestion
- Replication
- Execution lifecycle
Each specialist works from the customer’s own lineage and runs an impact analysis across the downstream graph. The output covers observations, root cause, impact and a resolution plan with code snippets and commands, and a person approves and acts on it, which Pantomath calls the Recommend stage.
Pantomath evaluates each specialist against held-out real-world incident scenarios but publishes no accuracy figures, so a demo on one of your own incidents is the only evidence available before purchase. Sifflet’s agent line is at a similar stage, with Sentinel available and Sage and Forge in early access.
Circuit Breakers and Self-Healing
Pantomath lists Dynamic Containment, circuit breakers that pause downstream jobs depending on faulty data, and Intelligent Self-Healing, which re-runs only the impacted downstream assets. It marks the Resolve stage as coming soon, and autonomous cross-platform resolution is being co-developed with design partners. Buy Pantomath for detection, triage and recommendations today, not for autonomous repair.
Reviewer’s Notes: I recommend asking which remediation features are generally available under your contract and naming them in the order form. A plan with executable commands still leaves execution and validation to your engineers.
Integrations, Security and Vendor Stability
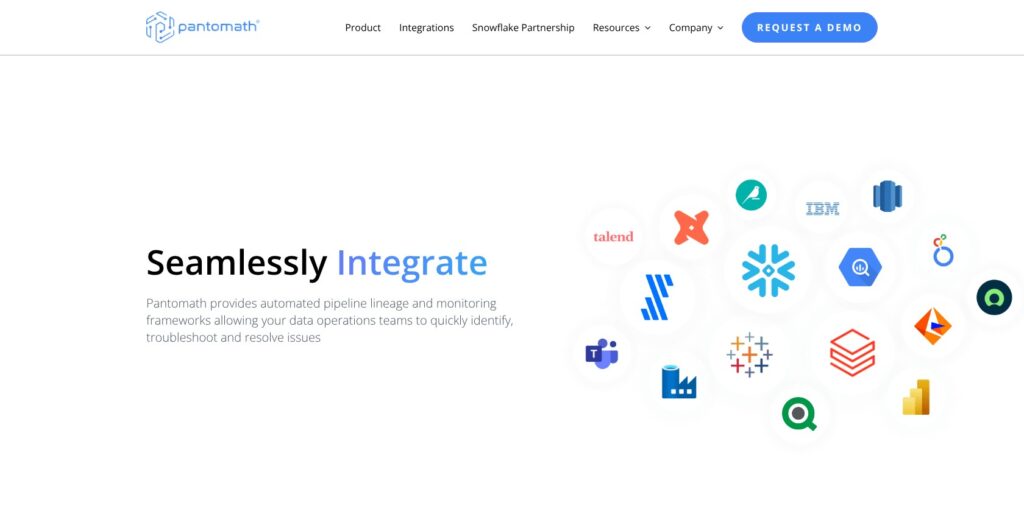
Pantomath lists 58 integrations across 13 categories, against 68 for Acceldata, and its list reaches legacy enterprise tools such as Control-M, SSIS, IBM DataStage and SAP BusinessObjects.
- Orchestration: Apache Airflow, Astronomer, Control-M, dbt, Google Cloud Composer and Power Automate.
- Data integration: Azure Data Factory, Fivetran, Google Cloud Dataproc, HVR, IBM DataStage, Informatica, Matillion, Qlik, SSIS and Talend.
- Warehouses and lakes: Snowflake, Databricks, BigQuery, Amazon Redshift, Azure Synapse, Microsoft Fabric, AWS S3, Azure Data Lake Storage and Google Cloud Storage.
- BI: Power BI, Tableau, Looker, Qlik, Sigma, SSRS, SAP BusinessObjects, ThoughtSpot and Microsoft Fabric.
- Incidents and alerts: ServiceNow, Jira, Slack, Microsoft Teams, PagerDuty, Google Chat and email.
- Other: Oracle, SQL Server, MySQL, Azure SQL, Kafka, Confluent, Alation, Dataiku, GCP Dataform and SSAS, plus Java, JavaScript and Python SDKs.
Autosys is not on the list, and the Databricks connector covers AWS and Azure workspaces, with GCP not listed.
Pantomath shows SOC 2 and ISO/IEC 27001:2022 badges and runs a Trust Center at trust.pantomath.com, but the SOC 2 report type is not public; Elementary, by contrast, states SOC 2 Type II. Delivery is SaaS only, with no published self-hosted or VPC option, which sends deployment-controlled teams to Sifflet (self-hosted VPC) or Acceldata (on-premises or Kubernetes).
Pantomath was founded in 2022 in Cincinnati, Ohio, and launched its first product in 2023. It raised a $14 million Series A in October 2023, led by Sierra Ventures, and a $30 million Series B on August 4, 2025, led by General Catalyst; Snowflake Ventures added an undisclosed investment announced January 29, 2026. A vendor this young, even freshly funded, justifies a 12-month first term.
How Does Pantomath Compare to Competitors?
Pantomath competes on two fronts: data observability platforms such as Monte Carlo, Sifflet and Metaplane, and job monitors such as IBM Databand and Datadog Data Jobs Monitoring. Pantomath sits between the two groups, starting from the failed job and tracing it to the data it breaks.
- Monte Carlo: Wins for teams whose main problem is bad warehouse data but who also want job-failure alerts across dbt, Airflow, Fivetran and Prefect. It added Azure Data Factory, Informatica and Databricks Workflows observability with multi-system lineage, and sells credit-based Start, Scale, Enterprise and Business Critical tiers with no public per-credit price; Scale adds SSO and SCIM, and Business Critical a dedicated instance.
- Acceldata: Wins for regulated teams that cannot send metadata to a SaaS tool, with on-premises, cloud, hybrid or Kubernetes deployment. It lists 68 integrations and publishes no prices.
- IBM Databand: Wins for IBM shops and buyers who want a free trial before talking to sales. Now part of IBM watsonx.data integration observability, it alerts on run duration, counts and freshness SLAs through Slack, PagerDuty and email; prices are not public.
- Sifflet: Wins for teams that need a self-hosted VPC or hybrid deployment and asset-based pricing, with tiers at 500, 1,000 and 1,000-plus monitored assets and no public dollar prices. Like Pantomath, it accepts Snowflake credits.
- Metaplane: Wins for small warehouse teams on a budget: the free tier covers 10 tables, and Pro and Enterprise charge per monitored table at unpublished rates, payable with Snowflake credits.
- Elementary: Wins for dbt-centric teams. It pairs a self-hostable open-source dbt package with Elementary Cloud, which needs only read access to its metadata schema, states SOC 2 Type II, and prices by seats and tables, with tiers by quote.
- Datadog Data Jobs Monitoring: Wins for teams already on Datadog that only need job health. It covers job failure and duration alerts and Spark stage analysis for Databricks, Airflow, dbt, AWS Glue, Azure Data Factory, and Spark on Kubernetes, EMR and Dataproc.
How I Reviewed Pantomath
For this Pantomath review, I worked through the Data Operations Center in November 2026, connected an orchestration, warehouse and BI chain (Azure Data Factory, Databricks, Snowflake and Power BI), and followed a failed job from alert to an auto-created ticket and the AI agents’ resolution plan. I also checked the 58-integration list and the SOC 2 and ISO/IEC 27001:2022 badges, and priced Pantomath against Monte Carlo, Acceldata, IBM Databand, Sifflet, Metaplane, Elementary and Datadog Data Jobs Monitoring.
Pricing and contract terms carried the most weight in my verdict, followed by traceability and monitoring, the incident workflow and AI agents, integrations and security, and vendor stability. SaaS-only delivery and the Recommend-stage limit on the agents were the two largest deductions; legacy connector coverage and the auto-filled tickets earned the most credit.
Prices current as of November 2026.
Should You Buy Pantomath for Data Pipeline Observability?
I recommend Pantomath for enterprises whose pipelines cross several orchestration, ETL and BI tools, including legacy ones such as Control-M, Informatica, IBM DataStage and SSIS, and who already run incidents through ServiceNow or Jira. Job-plus-data lineage feeding auto-filled, RACI-routed tickets is the reason to buy, provided a $250,000 12-month contract plus metered usage fits the budget. Buy it for detection, triage and recommendations, and start on the 12-month term, because AWS fees are non-cancellable and Pantomath has only shipped product since 2023.
Skip Pantomath if:
- Your stack is dbt plus one warehouse: Metaplane’s free 10-table tier or Elementary’s open-source package covers table checks.
- Self-hosting is mandatory: Sifflet offers self-hosted VPC deployment, and Acceldata runs on-premises or on Kubernetes.
- You need a trial first: IBM Databand offers a free trial; Pantomath starts with a sales demo.
- You expect autonomous fixing today: Pantomath’s agents recommend fixes for a person to approve, and the Resolve stage is still marked coming soon.
Request a Pantomath demo on your own failure chain, and get the metered usage unit and the generally available features written into the order form before signing.
FAQ
How much does Pantomath cost?
Pantomath’s Core Platform costs $250,000 for a 12-month contract on AWS Marketplace, plus $0.01 per unit of metered usage, a unit Pantomath does not define publicly. AWS Marketplace also offers 24- and 36-month terms without a public price, and Snowflake customers can buy through Snowflake Marketplace with Snowflake credits. Pantomath’s own site shows no prices.
Does Pantomath have a free trial?
Pantomath has no free trial, sandbox or self-serve signup; access starts with a demo request through its form or sales@pantomath.com. AWS Marketplace fees are non-cancellable and non-refundable except as required by law, so ask for the demo on your own failure chain before signing. IBM Databand is the closest rival with a free trial.
What does Pantomath integrate with?
Pantomath lists 58 integrations across 13 categories, from orchestration (Control-M, Apache Airflow) and data integration (Informatica, Azure Data Factory) to warehouses (Snowflake, Databricks), BI (Power BI, Tableau) and service management (ServiceNow, Jira). Autosys and Databricks on GCP are not listed. See Integrations, Security and Vendor Stability above for the full breakdown.
Is Pantomath a data quality tool?
Pantomath monitors field-level data quality, freshness and volume, but its core is job and pipeline observability with cross-platform traceability. It syncs Snowflake Data Quality data metric functions into its incident framework, and its Alation partnership pairs Alation’s governance and data quality with Pantomath’s pipeline observability. For dataset checks alone, Metaplane or Elementary is the cheaper fit.
Can Pantomath fix pipeline failures automatically?
Pantomath’s agents stop at a resolution plan for a person to approve and carry out, with code snippets and commands. The Resolve stage is marked coming soon, and autonomous cross-platform resolution is being co-developed with design partners. Pantomath also lists Dynamic Containment circuit breakers and Intelligent Self-Healing re-runs; ask which are generally available under your contract.