
Editor’s note: Our Tableau review evaluates pricing, dashboard design, data preparation, and AI capabilities through product research and editorial analysis.
Quick verdict: I recommend Tableau for analytics teams that need flexible visual exploration and interactive dashboards for a wider business audience. Its appeal is the control you get over your analysis, but licensing and maintaining useful reports require more thought than the entry price suggests.
Tableau sits in the enterprise BI category, and that is the right way to approach it. You are choosing how analysts build reports, how colleagues explore them, and who takes responsibility for the data behind them. For a few simple weekly charts, I would consider Metabase or Power BI first.
Key Takeaways
- Best for analyst-led reporting: Tableau combines visual analysis with dashboards you can distribute across a business.
- You can start privately for free: Desktop Free Edition supports local analysis without publishing your work online.
- Deployment is a choice: Tableau Cloud is hosted, while Tableau Server gives your organization responsibility for its deployment.
- The lowest seat price is not an authoring plan: Your budget depends on user roles and the edition you choose.
- AI still needs supervision: Tableau Agent can assist with analysis, but it does not remove the work of defining and checking your data.
In this review, I’ll take a closer look at the costs, everyday workflow, and AI limitations that would influence my buying decision.

Tableau Pros and Cons
Pros
- Interactive dashboards combine multiple views of the same business question.
- Separate phone, tablet, and desktop layouts support different audiences.
- Desktop Free Edition allows private local analysis for business use.
- Tableau Prep provides visual cleaning steps and inspectable join results.
- Pulse brings defined business metrics into email and Slack digests.
Cons
- Paid collaboration involves annual commitments and role-based licensing.
- Free desktop work cannot be shared as packaged workbooks.
- Live connections and extracts require different freshness and performance decisions.
- Agent in authoring cannot build an entire dashboard or model your data.
How Much Does Tableau Cost?
Budget for the people building reports as well as the people reading them. Tableau sells editions with different capabilities, then licenses users according to their roles.
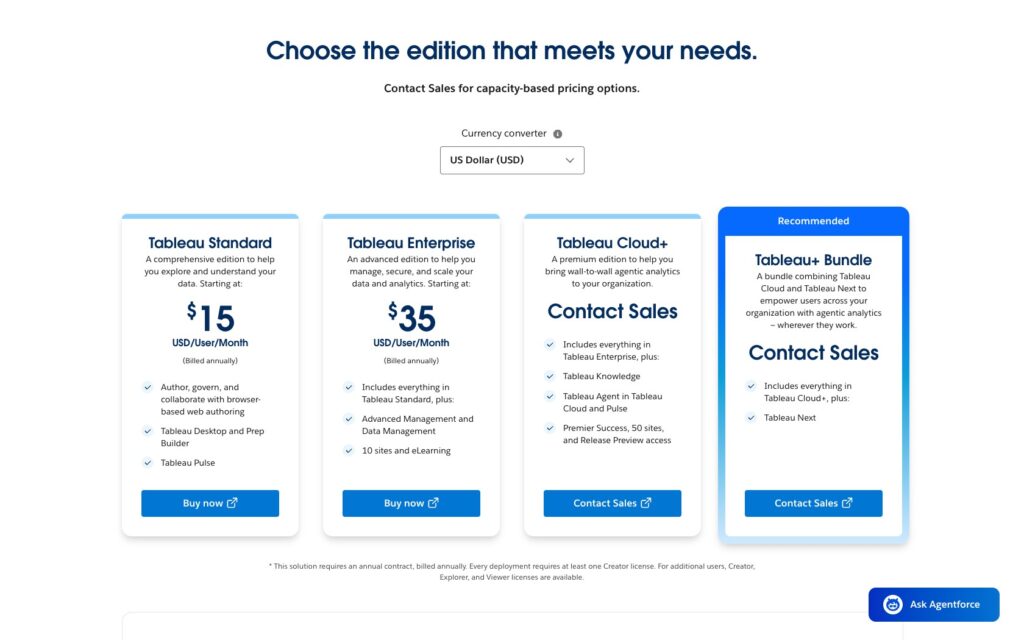
- Standard (from $15/user/month): For teams that need the core authoring and sharing platform.
- Enterprise (from $35/user/month): For organizations needing added data and administrative management.
- Cloud+ (custom pricing): For the premium Cloud offering with Tableau Agent and additional capabilities.
- Tableau+ Bundle (custom pricing): For organizations combining Cloud+ with Tableau Next.
Cloud requires an annual contract, billed annually, with at least one Creator. These are US dollar list prices:
| Cloud license | Standard per user/month | Enterprise per user/month |
|---|---|---|
| Creator | $75 | $115 |
| Explorer | $42 | $70 |
| Viewer | $15 | $35 |
For an illustrative team with one Creator, two Explorers, and ten Viewers, Standard totals $309 per month equivalent, or $3,708 annually. The same mix on Enterprise comes to $605 per month equivalent, or $7,260 annually. Allow separately for implementation and any infrastructure you manage.
Is Tableau Good Value for Money?
I think Tableau is easier to justify when several departments reuse well-maintained dashboards. It is harder to justify when most people only need a monthly spreadsheet export.
Before choosing an edition, work out:
- Who builds from new data: Creator is the role to assess for full authoring and preparation.
- Who explores existing content: Explorer suits people who need more freedom within prepared analytics.
- Who consumes reports: Viewer supports dashboard interaction without full authoring.
Larger deployments should also assess capacity licensing. Tableau offers Viewer capacity blocks for Cloud, while Creators and Explorers remain individually licensed. This makes audience size and usage patterns part of the purchasing discussion.
My recommendation for a small analytics team is to assess Standard with the minimum sensible mix of authoring and viewing roles. Move up when you can name the management capability you need. For Salesforce-centered AI workflows, evaluate Next separately; its advertised starting price is $40 per user per month on an annual contract.
Getting Started With Tableau
Desktop Free Edition is the most useful starting point for private, individual evaluation. It supports business use and local analysis, but it cannot publish to Cloud, Server, or Public, or share packaged workbooks.
That distinction matters. Tableau Public is intended for public-facing work, and published visualizations and underlying data are downloadable by default. I would use Desktop Free for exploring business data locally and reserve Public for appropriate public examples and portfolios.
You can begin with a spreadsheet or connect to an existing database. The connection you choose affects credentials, refresh arrangements, and how colleagues will eventually access the result.
For an initial evaluation, I would use a narrow question such as: Which product categories grew revenue but lost margin? A useful sequence is:
- Connect a suitable dataset. Start with data whose totals you already understand.
- Check the fields. Confirm dates and numeric values have the intended types before building charts.
- Create separate views. Compare category revenue, margin, and changes over time.
- Combine the views in a dashboard. Give readers a clear route from the overall result to a category.
- Check the totals and access model. Decide how the work will be refreshed and shared before expanding it.
A useful dashboard should survive a follow-up question. If a colleague asks why one category grew, they should be able to inspect the contributing data, and the analyst should be able to explain the calculation. That matters more to me than polishing the first chart.
For a team that mainly wants straightforward database questions and reusable reports, Metabase deserves an early comparison. Tableau becomes more compelling as your visualization and interaction requirements become more specific.
Building Dashboards With Tableau
Tableau builds dashboards from worksheets, giving you control over how individual views work together. You create the views first, then bring them into a dashboard and arrange them for the reader.
I like this flexibility for reports that need to answer follow-up questions. A sales dashboard can start with a monthly trend, then let the reader select a region and inspect the products behind a change. The layout should make that sequence obvious without requiring a tour from the analyst who built it.
For a practical design review, I would look at:
- The opening view: Can someone identify the main result without searching through several charts?
- The interaction: Is it clear which selection changes the other views?
- The detail: Can readers investigate a result without losing sight of the original question?
Tableau also supports device-specific layouts. You can create phone, tablet, and desktop versions of a dashboard and publish them through one URL. That is useful when an executive checks a metric on a phone while an analyst works through the detail on a larger display.
My reservation is the ongoing design work. A layout that accommodates ten categories might need attention when the business adds fifty. Similarly, a useful desktop chart can become cramped on a phone. Device layouts give you control, but somebody still has to exercise it.
Compared with Looker, I would put Tableau higher on the shortlist when the analyst’s main priority is visual exploration. Looker’s modeling approach deserves more attention when the organization wants developers to maintain shared business definitions centrally.
Preparing Data and Keeping Reports Current
Tableau Prep helps you clean and reshape data before it reaches a dashboard. Its visual workflow supports operations such as renaming fields, changing types, splitting values, and grouping inconsistent entries.
I particularly value being able to inspect what a cleaning step changes. If different source files use slightly different category names, grouping them before analysis is more dependable than asking every report author to remember the same correction.
Joins deserve particular attention. Tableau Prep exposes included and excluded rows alongside join conditions and results. For a proposed sales-and-returns workflow, I would inspect whether unmatched orders disappear and whether multiple return records duplicate sales values. These are the kinds of errors a convincing chart can hide.
I would also decide how fresh the output needs to be before choosing a connection strategy:
| Connection approach | Practical benefit | What you need to manage |
|---|---|---|
| Live connection | Queries the connected source | Source availability and query performance |
| Extract | Uses a stored snapshot for analysis | Refresh timing and the age of the data |
A Tableau dashboard is not automatically real time. An extract can be appropriate for a daily management report, while an operational use case may need a different freshness arrangement. I would make the expected update time visible to readers.
Tableau Cloud does not support running Prep script steps that use R or Python. If your existing preparation depends on those scripts, resolve where that work will run before you choose the hosted setup.
My advice is to evaluate the reporting workflow from source to reader. The chart editor cannot compensate for an unclear refresh schedule or a join that changes the meaning of a total.
Tableau AI: What Pulse, Agent, and Next Actually Do
Pulse tracks metrics, Agent assists with analysis, and Next brings analytics into Salesforce workflows. Choose around the job you need done before paying for an AI upgrade.
Pulse: Keeping Track of Defined Metrics
Tableau Pulse focuses on metrics that people want to follow. An authorized author sets up a definition with a measure, aggregation, time dimension, and relevant filters. Readers can follow the resulting metrics and receive digests through email or Slack.
I like this approach for recurring business questions. A manager should not need to reopen a large dashboard every morning just to check whether an agreed metric has changed.
A revenue definition that counts bookings will disappoint a finance team expecting recognized revenue. An accessible summary makes a mistaken definition easier to distribute. I would settle ownership of each metric before rolling out digests widely.
Agent: Help With Authoring, Within Limits
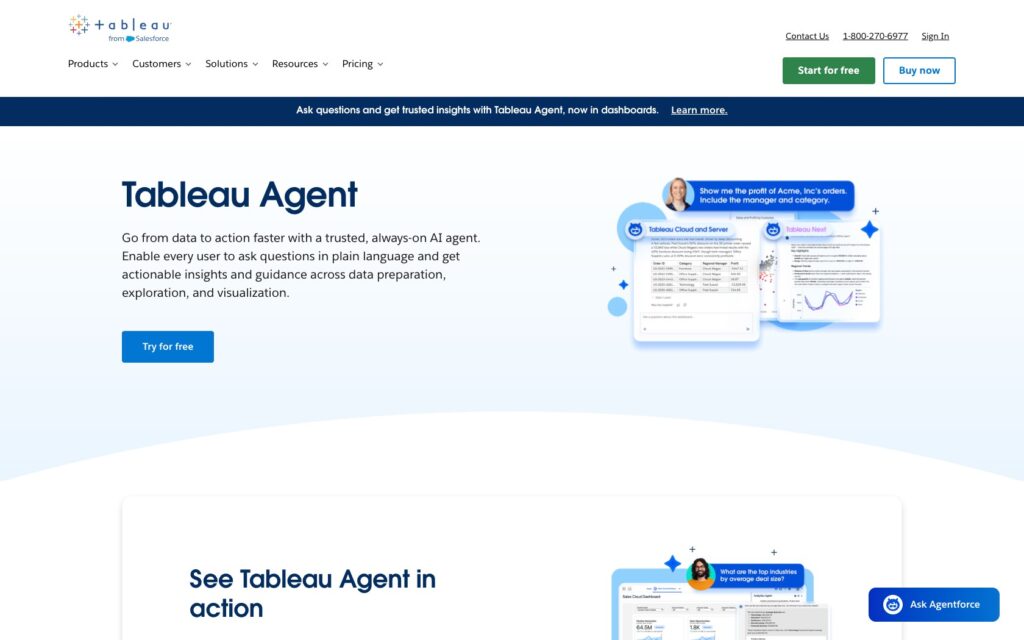
Tableau Agent can help an author explore connected workbook data, create visualizations, and generate or explain calculations. That makes it interesting as an assistant for expressing an analysis, especially when someone knows the business question but needs help with the implementation.
However, the authoring assistant has specific boundaries:
- It cannot choose your data source or model the data for you.
- It cannot build an entire dashboard in the authoring workflow.
- It cannot create filter or parameter interactivity there.
- With blended data, its support is limited to the primary source.
I recommend Agent for an analyst who can check its work. Someone still needs to choose suitable data and turn individual views into a coherent report.
A generated calculation needs the same scrutiny as a manually written one. Check the aggregation, the date range, and what happens to missing values. Fluent explanations do not establish that a metric matches your business rules.
Next: A Separate Salesforce-Oriented Decision
Tableau Next is a complementary analytics product built on the Salesforce platform. It combines semantic context and conversational analytics with workflows in the Salesforce environment.
That makes it more relevant if your intended outcome is an action within a CRM workflow. If your immediate need is simply to build better dashboards from a warehouse, I would evaluate the core Tableau workflow first and ask for a clear reason to add Next.
For a demonstration, bring a question from your own reporting workflow. Ask the vendor to show which steps Agent completes and which require an analyst, with the exact edition and feature availability recorded in the proposal.
How Does Tableau Compare to Competitors?
Power BI is my first price comparison; Looker and Metabase address different priorities. I would shortlist them around the work your team needs to do.
- Power BI: For Microsoft-heavy teams watching seat costs. Pro lists at $14 per user per month, paid yearly, and is included in Microsoft 365 E5 and Office 365 E5. That makes it worth evaluating before committing to Tableau, although the products’ licenses and capabilities are not interchangeable.
- Looker: For centrally modeled analytics. LookML defines dimensions, calculations, and relationships that generate database queries. I would favor this approach when developers are expected to own common business definitions. Pricing includes platform and user components, so compare a complete quote.
- Metabase: For database reporting with an open-source option. You can self-host its free edition or choose managed hosting. I would start here for a team that wants accessible questions and dashboards before committing to a more involved enterprise BI rollout.
| Product | Why I would shortlist it | Main decision to resolve |
|---|---|---|
| Tableau | Flexible visual analysis and interactive dashboards | Who owns the reports and the license mix? |
| Power BI | Microsoft fit and lower listed Pro seat price | What sharing and capacity setup is required? |
| Looker | Developer-maintained business definitions | Who will maintain the modeling layer? |
| Metabase | Accessible database reporting and self-hosting | Which governance features require a paid plan? |
I would compare one recurring report across the shortlist. Include its preparation, permissions, and refresh requirements. Comparing attractive sample charts alone misses much of the work you will live with after purchase.
How I Reviewed Tableau
I evaluated Tableau’s documented authoring workflow, licensing, data preparation, deployment options, and AI limitations against likely buying needs. I also compared the official capabilities and commercial models of Power BI, Looker, and Metabase. The recommendations assess product fit and documented capabilities; they do not establish measured performance or AI accuracy.
Prices checked in October 2026.
Should You Choose Tableau?
Choose Tableau if visual analysis is a core part of your team’s work and someone can own the reporting workflow. Its dashboard composition, preparation tools, and distribution options make a strong case for analyst-led teams.
I would begin with Desktop Free for individual evaluation, then price the collaboration setup you actually need. Compare Power BI before committing if Microsoft integration and cost dominate your decision. Consider Metabase if your reporting requirements are simpler, or Looker if centrally managed definitions matter most.
FAQ
Is Tableau Free?
Desktop Free Edition supports private local analysis, including business use. Publishing and sharing require a different offering. Tableau Public is intended for public-facing work.
Is Tableau Suitable for Beginners?
You can start with a familiar spreadsheet, but reliable reporting still requires understanding data types, aggregations, and relationships. I would begin with one narrow question.
Can Tableau Be Self-Hosted?
Yes. Tableau Server is the self-managed option. Tableau Cloud is the hosted alternative.
Does Tableau Agent Build Entire Dashboards?
Not in its authoring workflow. It assists with tasks such as visualizations and calculations, while dashboard construction and data modeling remain separate work.
Is Tableau Next the Same as Tableau Desktop?
No. Next is a Salesforce-oriented analytics product. Desktop is the authoring application for visual analysis and workbook creation.