Editor’s note: This Sifflet review evaluates the pricing model, setup requirements, and documented capabilities. It is not a hands-on performance test.
Quick verdict: I recommend Sifflet for data teams on Snowflake, BigQuery or Databricks who want monitoring, lineage and a catalog in one contract instead of two. The trade-off is pricing: there are no list prices, and the one public figure is a $48,000 12-month contract on AWS Marketplace.
Sifflet ships 22 monitor templates, ML dynamic thresholds, field-level lineage into Looker, Tableau and Power BI, and a Sentinel agent that suggests monitors from your metadata.
Key Takeaways
- Catalog, lineage, monitors and incidents come in one product, priced per monitored asset
- Automatic Monitoring applies freshness, volume and schema-change checks to whole schemas; Sentinel suggests the rest from metadata
- Monitors can live in Git as YAML and deploy from the CLI with
sifflet code workspace apply - No list prices: the only public figure is $48,000 a year on AWS Marketplace, and an “asset” is not formally defined
- Terraform does not manage monitors, and there is no Informatica Cloud connector
For this review, my priority is whether Sifflet replaces two purchases, an observability tool and a catalog, well enough to justify an enterprise contract. If you only need freshness checks on a few dozen tables, I would start with a cheaper tool.
In this Sifflet review, I’ll take a closer look at Sifflet’s pricing, setup, monitoring, lineage and AI agents, so you can see exactly whether it earns a place in your stack.
Sifflet Pros and Cons
Pros
- Catalog, lineage, monitors and incidents in one product
- 22 monitor templates with static, relative or ML dynamic thresholds
- Field-level lineage through dbt into Looker, Tableau and Power BI
- Monitors as YAML in Git, deployed with the CLI
- SaaS, hybrid or self-hosted, with SOC 2 Type 2 and ISO 27001
Cons
- No list prices, and $48,000 a year is the only public number
- Noisy alerts until you tune thresholds and label false positives
- Terraform manages credentials and sources, not monitors
- No Informatica Cloud connector, thin legacy on-prem coverage
How Much Does Sifflet Cost?
Sifflet sells three plans sized by monitored assets and publishes no list prices. The one public number is on AWS Marketplace, where a 12-month contract lists at $48,000, billed as platform credits that you draw down as assets and monitors grow, with fees that are non-cancellable and non-refundable.
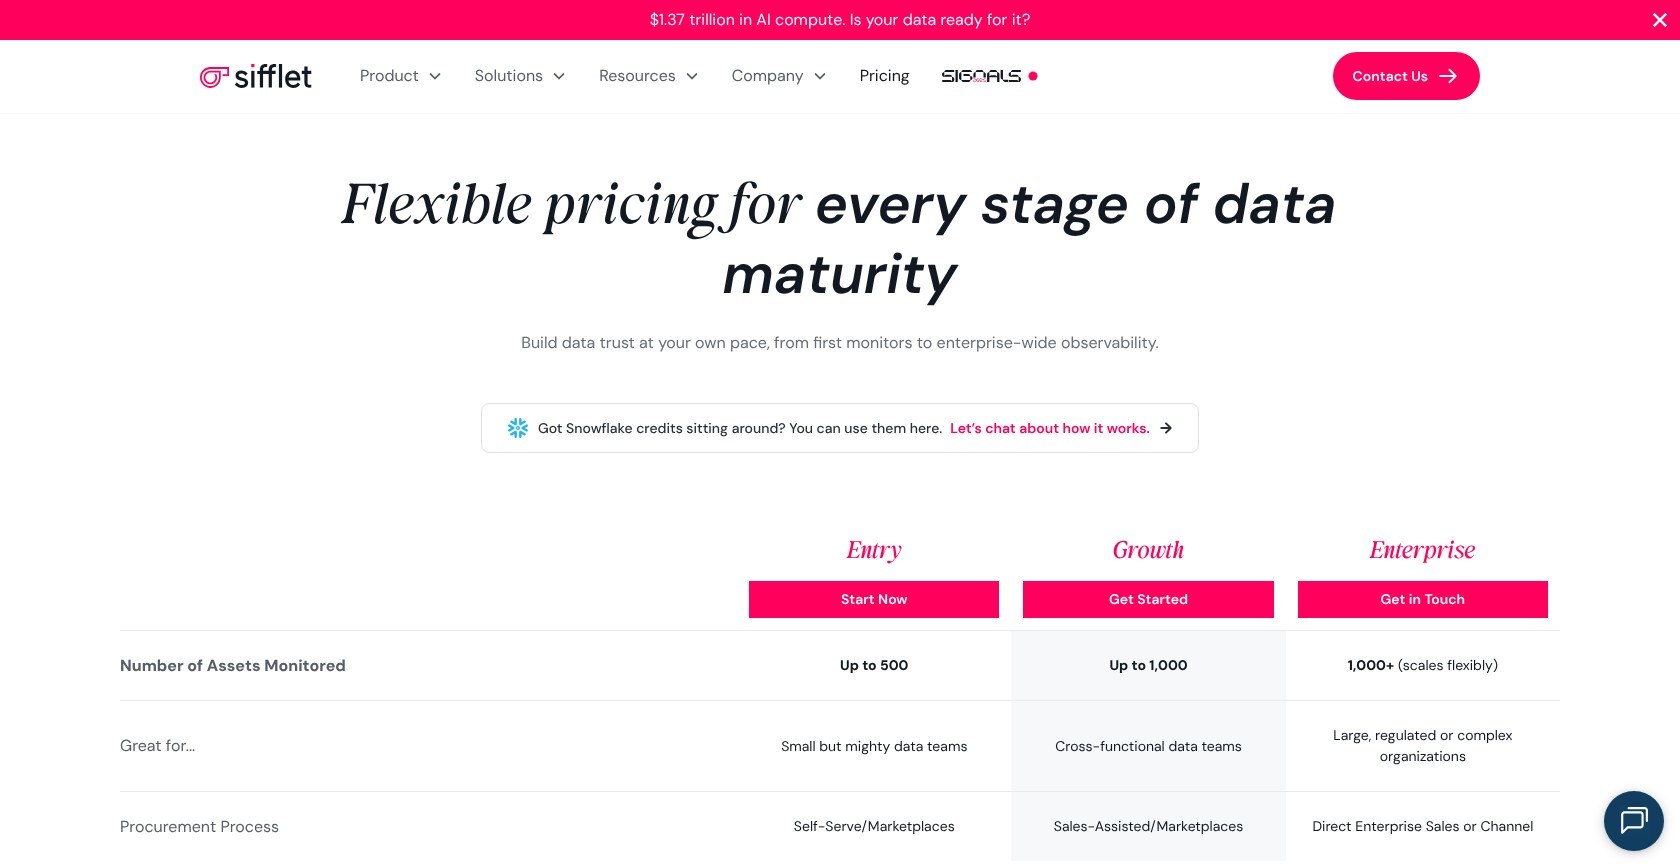
- Entry (up to 500 assets): for small data teams; self-serve or marketplace purchase, SaaS only, standard support and guided onboarding
- Growth (up to 1,000 assets): adds SSO and data sharing of Sifflet’s own metadata into Snowflake, BigQuery or S3, with priority support and dedicated onboarding
- Enterprise (1,000+ assets): adds pipeline monitoring, early access to the Sage and Forge agents, hybrid or self-hosted deployment and 24/7 support
Every plan carries the core: catalog, lineage with impact analysis, incidents with root-cause analysis, RBAC and the Sentinel agent.
| Plan | Assets monitored | Deployment | Support | Notable additions |
|---|---|---|---|---|
| Entry | Up to 500 | SaaS | Standard, guided onboarding | Core observability, catalog, lineage, Sentinel |
| Growth | Up to 1,000 | SaaS | Priority, dedicated onboarding | SSO, data sharing to Snowflake, BigQuery or S3 |
| Enterprise | 1,000+ | SaaS, hybrid or self-hosted | 24/7 | Pipeline monitoring, early access to Sage and Forge |
Sifflet’s catalog counts tables and views, dashboards and pipelines as asset types, but Sifflet does not formally define the billable unit. A 400-table warehouse feeding 150 dashboards may or may not fit inside Entry, so I would settle that in the demo before picking a tier.
Snowflake customers can put Snowflake credits toward the contract, which matters if you have committed spend to burn.
Is Sifflet Good Value for Money?
- Monte Carlo lists a 12-month AWS Marketplace contract at $50,000, so the two sit within $2,000 of each other at the public anchor
- Soda has a Free plan and a Team plan at $750 a month, roughly $9,000 a year for code-first checks without a catalog
- Metaplane’s free plan covers 10 monitored tables, enough for a proof of concept but not a warehouse
- GX Core and Elementary’s open-source package cost nothing, but you host them and you get testing, not lineage into dashboards
Sifflet is priced like enterprise software, and I see its value in not buying a separate catalog alongside it. If you would otherwise pay for an observability product plus a catalog, the single contract is defensible; if you only need freshness checks on 50 tables, it is not.
Reviewer’s Notes: My recommendation is Entry, scoped to your most critical data products under the 500-asset cap. Move to Growth when you need SSO or want Sifflet’s metadata shared back into your warehouse, rather than buying capacity for every schema up front.
Getting Started With Sifflet
You need a warehouse admin before you need a data steward. Sifflet asks for a dedicated role, warehouse and service user before it reads anything, so the first step belongs to whoever holds ACCOUNTADMIN in Snowflake or the equivalent elsewhere.
- Create the Snowflake objects: a role, an X-Small warehouse set to auto-suspend, and a service user with key-pair authentication, since username and password login is deprecated
- Grant read-only access: USAGE on the warehouse, IMPORTED PRIVILEGES on the SNOWFLAKE database, then USAGE and SELECT on each schema you want monitored
- Add the source in Sifflet: Integrations > Credentials to store the key pair, then Integrations > Sources > New source > Snowflake, Load assets, pick schemas and tick “Automatically include new schemas”
- Turn on Automatic Monitoring: Settings > Automatic Monitoring applies Freshness, Volume and Schema Change monitors to every table in the selected schemas
I like that nothing in the setup asks for write access, which keeps the security sign-off short. Sifflet’s queries do run on your warehouse, though, so its refreshes and monitors show up on your Snowflake bill. Volume runs as a daily full table scan, so on a large schema it adds cost that the metadata-only freshness check does not.
The same flow covers BigQuery, Databricks, Redshift, Athena and Synapse, plus SQL Server, MySQL, Oracle and PostgreSQL.
Sentinel fills in what Automatic Monitoring leaves out. From an asset page, the catalog or a whole data product, it reads usage, schema and lineage metadata and proposes monitors such as uniqueness, allowed-value lists and distribution shifts, skipping anything that duplicates a monitor you already have. In Soda or GX you write each of those checks yourself.
For an initial rollout, I would group your critical tables into a data product first and scope notification rules to it. Monitoring everything at once is the noisiest option, and dynamic thresholds need a few rounds of false-positive labeling before alerts are worth acting on.
How Incidents Work
A failed monitor run or dbt test opens an incident, with related failures grouped into one instead of a flood. Each incident has a status (Open, In Progress, Closed), inherits the monitor’s severity, and assigns to a user or team.
The incident page has a one-click button to create a Jira or ServiceNow issue, and with Sage active the Overview shows a plain-language summary with likely root causes and the impacted downstream assets. Notifications reach Slack, Microsoft Teams, Google Chat, email or a JSON webhook; PagerDuty gets its alerts through the email route rather than a native connector, which I would check if your on-call rotation lives there.
Monitors, Thresholds and Monitors as Code
Sifflet ships 22 monitor templates in five groups, each usable from the UI or a YAML file:
- Table health: volume, freshness, freshness update gap, schema change and row-level duplicates
- Metrics: metrics, custom metrics and correlated metrics
- Field profiling: distribution change, nulls, unique, duplicates, value list, value range and referential integrity
- Format validation: email, phone number, UUID and regex match
- Custom: a SQL query, a SQL condition or a no-code condition
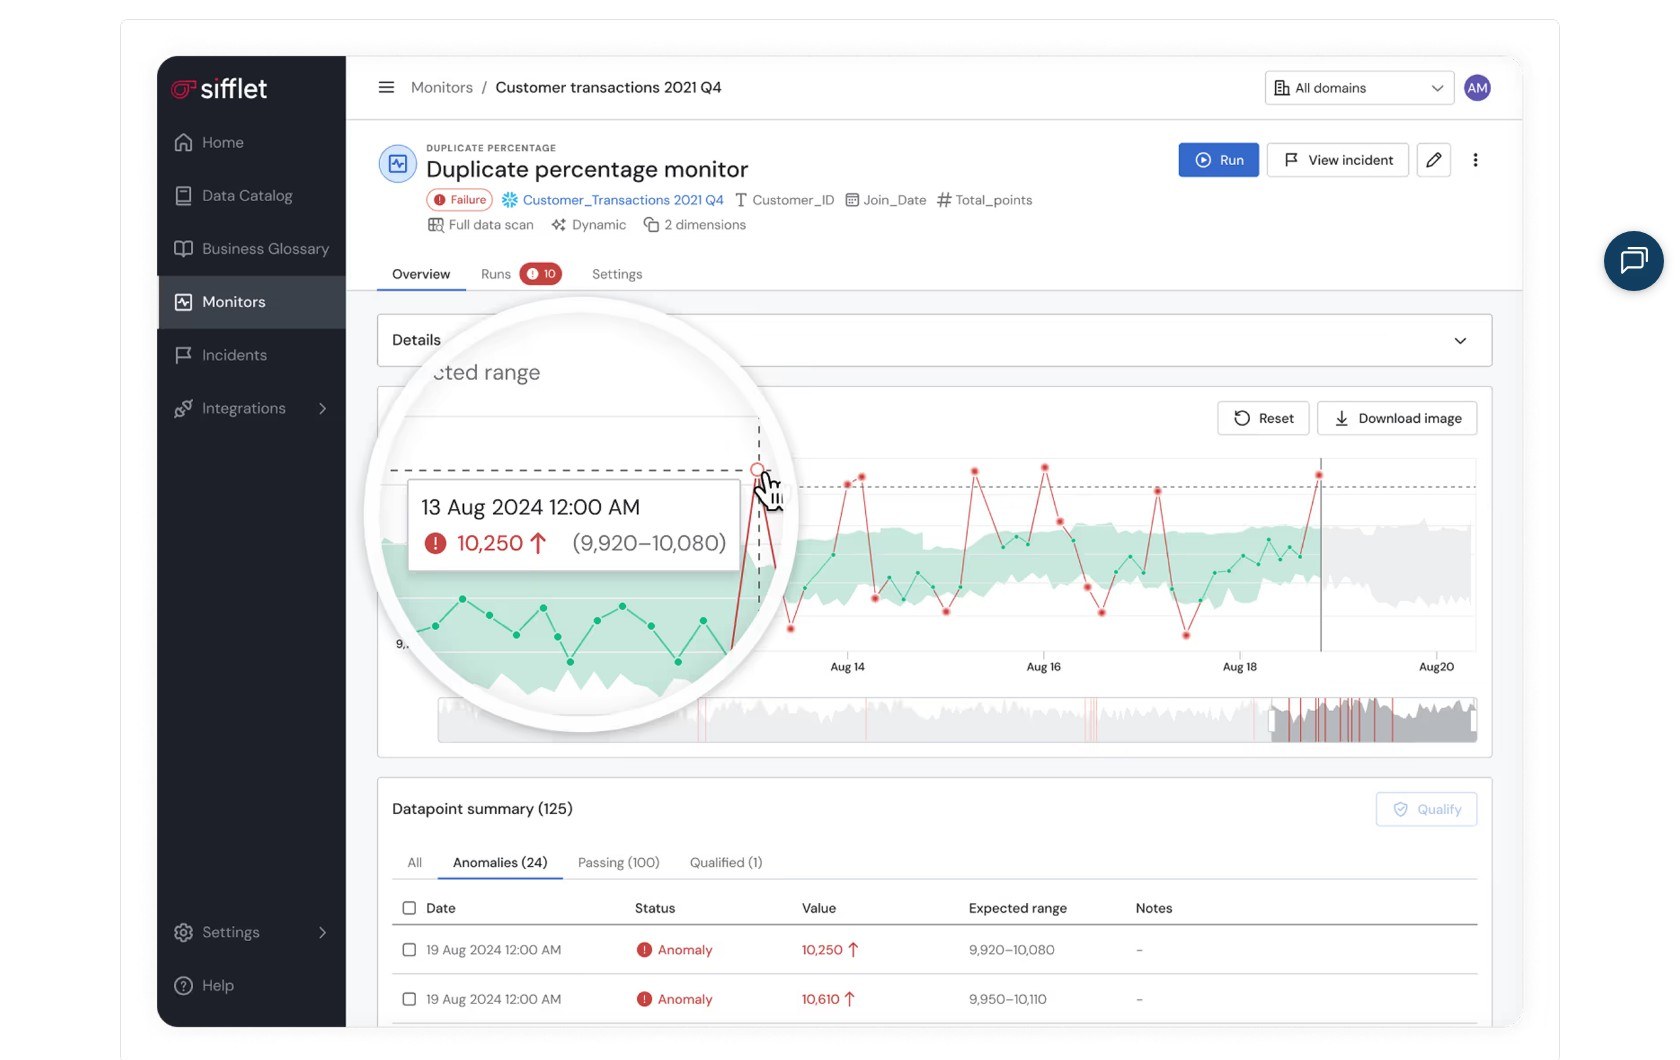
Static thresholds set a fixed minimum and maximum, relative thresholds compare against the previous window as a percentage or an absolute change, and dynamic thresholds fit an ML band that learns growth and seasonality. Dynamic monitors add a sensitivity setting, a feedback loop where you label points as false positives or negatives, and a special-dates list to exclude holidays. I like the special-dates list in particular: a Black Friday spike should not page anyone.
The AI Assistant covers text to SQL, text to monitor and text to regex, so an analyst can type a check in plain English.
Monitors as code puts each monitor in a YAML file grouped in a workspace, deployed with the Sifflet CLI and an Editor or Admin token: sifflet code workspace init to create the workspace, sifflet code monitor init to scaffold a monitor, then sifflet code workspace plan and sifflet code workspace apply. In CI you set SIFFLET_BACKEND_URL and SIFFLET_TOKEN and run apply with --auto-approve.
I would run plan every time. Applying a workspace deletes any monitor missing from your local files, and renaming a monitor id deletes the old monitor along with its history. Code-managed monitors turn read-only in the UI, and there is no migration path for monitors you already built by hand, only a “Show as YAML code” export to copy from.
The Terraform provider covers credentials, sources and users but not monitors, and there is no bulk edit for tags or several monitors at once, which I would expect to hurt at 1,000-asset scale. Soda is built code-first; Sifflet gives you both the UI and YAML, which I think is the better default for a mixed analyst and engineer team.
Lineage, Catalog and dbt
Lineage is table-level by default and expands to field level when you open a node, running from warehouse tables through dbt models into Looker, Tableau, Power BI, QuickSight, MicroStrategy and Qlik. Each node shows upstream and downstream counts, so impact analysis on a broken table ends at the named dashboards, not at the last warehouse hop.
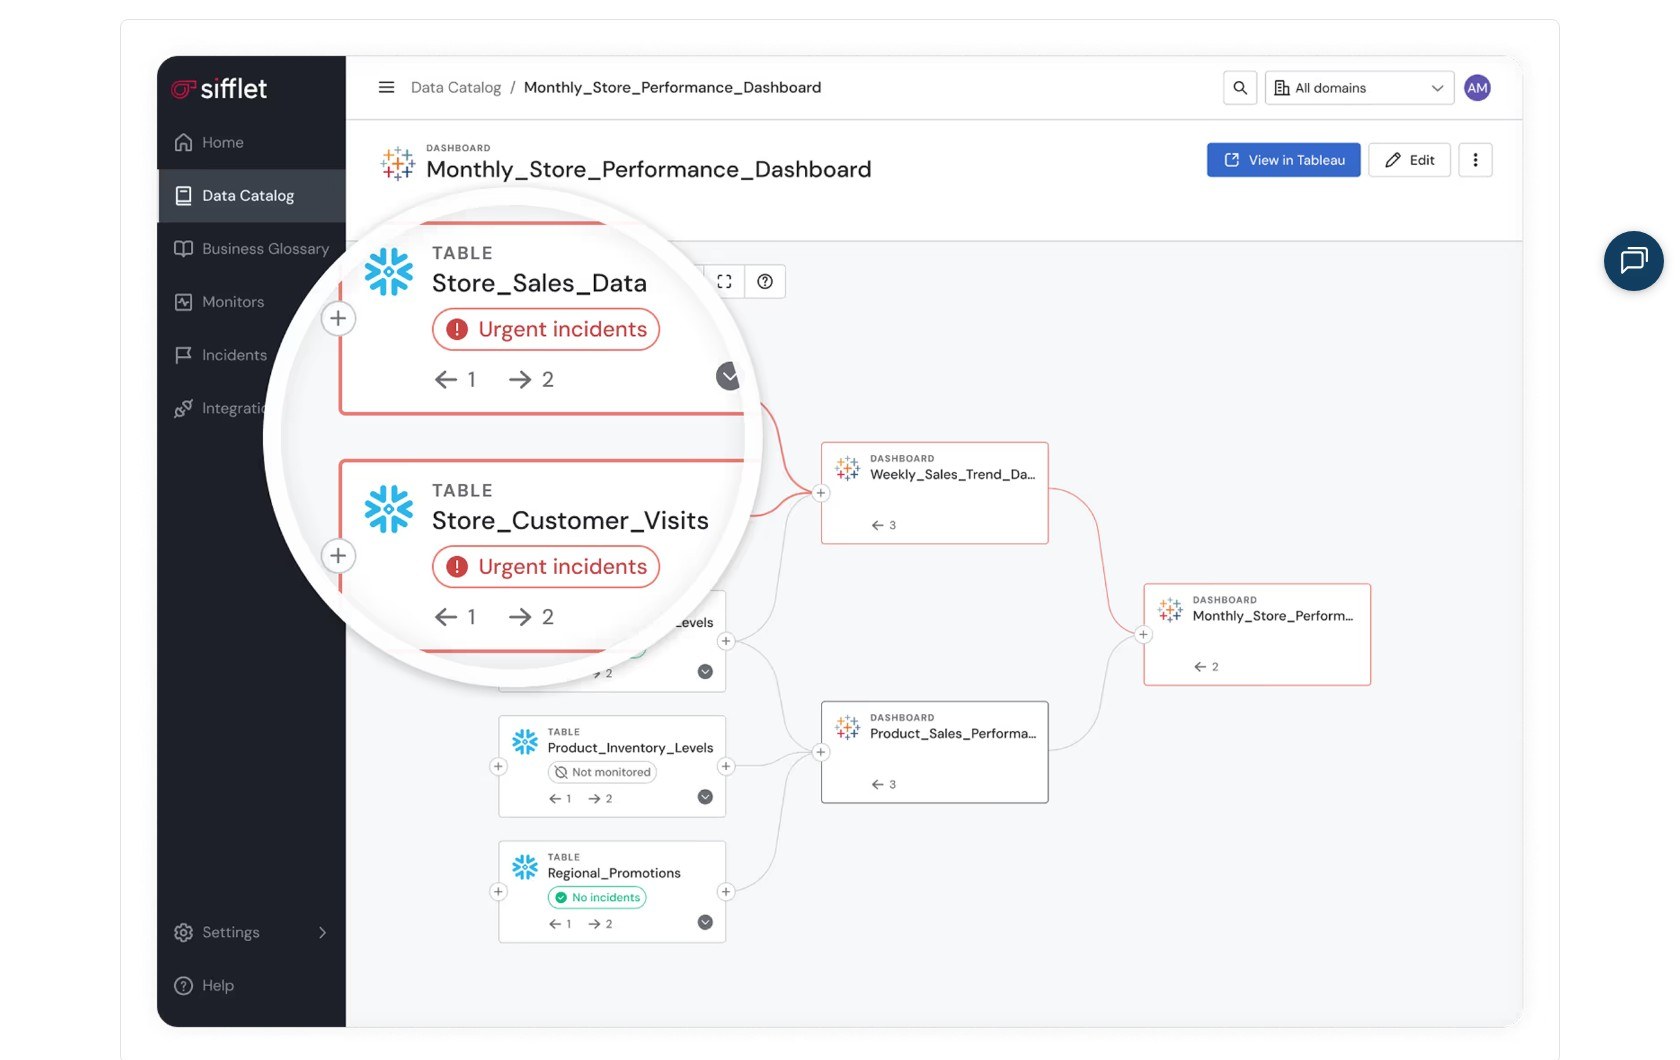
The Sifflet Insights browser extension carries that into the BI tool itself: a Looker or Tableau user sees upstream incidents on the dashboard they are looking at without opening Sifflet. For me, this is the feature that justifies the lineage work, because the person who notices bad numbers is rarely the person who opens an observability tool.
The catalog holds tags, terms, owners and descriptions, with bulk actions for all four plus Auto-Coverage, which creates monitors on a selection of assets in a few clicks. Two limits: bulk descriptions overwrite what was there, and saved filters stay personal rather than shared with a team.
If you already run Atlan, Sifflet connects to it as a catalog source rather than replacing it; if you are on Collibra, that connector is the first thing I would ask about in the demo.
Each dbt test becomes a Sifflet monitor with its own history, alerting and incidents, and failed or skipped model runs show on the table and on lineage, which makes dbt the strongest integration in the product. dbt Core uploads artifacts from your pipeline; dbt Cloud is polled with a read-only service token. A GitHub Action or GitLab CI component runs impact analysis on a pull request, so you see which dashboards a model change touches before merging.
Orchestration coverage spans Airflow (self-hosted, MWAA and Cloud Composer), Fivetran, Databricks Workflows and Azure Data Factory. There is no Informatica Cloud connector, and legacy on-prem sources stop at SQL Server, MySQL, Oracle and PostgreSQL.
If you have no catalog yet, this is where Sifflet’s price makes sense to me: the lineage and catalog you would otherwise buy from Atlan come in the same contract.
Are Sifflet’s AI Agents Useful?
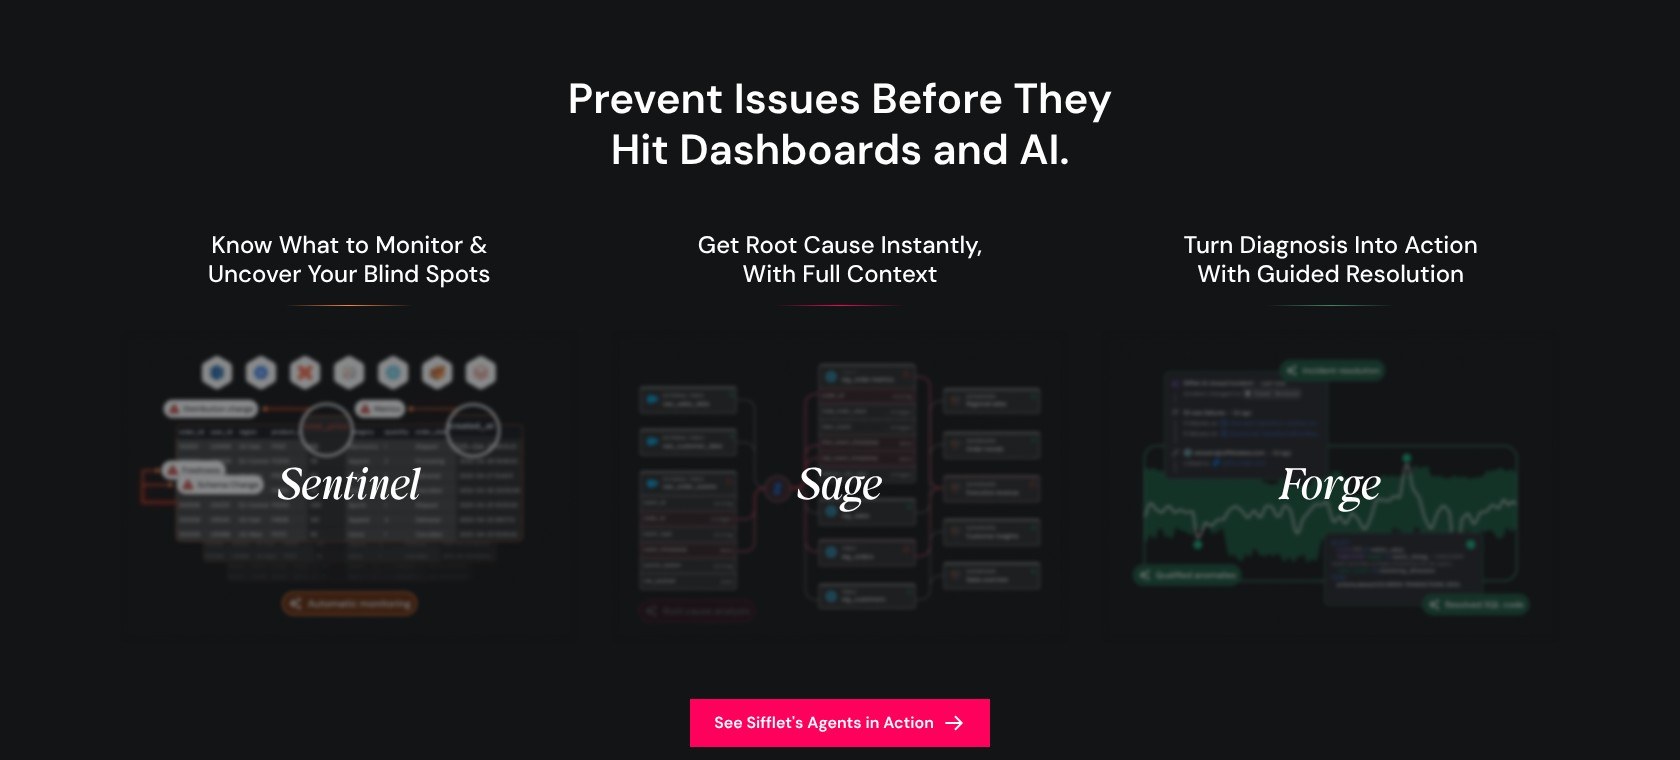
Only one of Sifflet’s three agents, Sentinel, is on every plan:
- Sentinel: reads metadata only (usage, schema, lineage) and suggests monitors from the asset page, the catalog or a data product; included on Entry, Growth and Enterprise
- Sage: writes an incident summary with likely root causes, impacted assets and next steps, drawing on incident history and dbt run logs; early access on Enterprise
- Forge: suggests fixes based on past incidents and never applies them, leaving the decision with you; early access on Enterprise
Sifflet AI Chat (beta, switched on by an admin) answers questions about data health, ownership gaps and incident trends, and produces downloadable reports. Sentinel and Sage call an OpenAI-hosted model and the chat calls Anthropic’s API, all on tenant metadata only; admins can switch each AI feature off individually, but a global off switch means contacting Sifflet.
I would judge the AI on Sentinel and the assistant, which you can use today. Sage and Forge are early access, so I wouldn’t let them decide the purchase; ask for a demo of Sage on an incident from your own stack before counting on it.
Deployment and Security
SaaS is the default deployment. Hybrid keeps the hosted instance but reaches private networks through a lightweight Docker agent (outbound HTTPS only, in preview for MySQL, Oracle and PostgreSQL) or a Snowflake native app. Self-hosted, including air-gapped, puts everything in your environment; hybrid and self-hosted are Enterprise options.
Security covers SOC 2 Type 2, ISO 27001 and GDPR, with a single-tenant instance per customer in the US, Europe or Asia. Access to your sources is read-only, Sifflet stores metadata and monitor results rather than source rows, and failing-row samples are pulled on demand and not kept. Customer data is not used to train AI models.
An MCP server lets Cursor-style IDEs query assets, incidents and lineage straight from the editor.
How Does Sifflet Compare to Competitors?
I would shortlist alternatives based on whether you also need a catalog. Sifflet’s $48,000 anchor lands in the same band as Monte Carlo, and each rival below wins a narrower niche.
- Monte Carlo: my first comparison if you already own a catalog. It is the most established pipeline observability and incident tooling in the category, with a 12-month AWS Marketplace contract at $50,000
- Bigeye: enterprise observability built around lineage-driven monitoring, quote-only; worth a look for large estates that want metric monitoring at scale over a catalog
- Anomalo: ML-first checks on the values inside tables rather than on metadata, quote-only; strongest when unsupervised anomaly detection on content is the whole brief
- Soda: code-first checks and data contracts, with a Free plan and Team at $750 a month; the budget route for engineering teams that already live in Git
- Metaplane: free for 10 tables and priced per monitored table above that, payable with Snowflake credits; the fastest start for a small modern-stack team
- Elementary: free and open source, dbt-native, writing results into your own warehouse; I’d pick it when dbt is the whole pipeline
- Great Expectations (GX): free GX Core and a free GX Cloud Developer plan; testing, not catalog or lineage
| Tool | Approach | Public price | Best for |
|---|---|---|---|
| Sifflet | Observability plus catalog and lineage | $48,000 for 12 months (AWS Marketplace) | Teams buying monitoring and a catalog together |
| Monte Carlo | Pipeline and incident observability | $50,000 for 12 months (AWS Marketplace) | Teams with a catalog that need monitoring depth |
| Bigeye | Lineage-driven enterprise monitoring | Quote only | Large estates monitoring metrics at scale |
| Soda | Checks as code, data contracts | Free; Team $750/month | Engineering teams in Git |
| Metaplane | Lightweight per-table monitoring | Free for 10 tables | Small modern-stack teams |
| Elementary | dbt-native, open source | Free (OSS) | dbt-only pipelines |
| Great Expectations | Testing framework | GX Core free; GX Cloud Developer free | Data testing without lineage |
On Sifflet vs Monte Carlo, if you can name a catalog you are keeping, I’d pick Monte Carlo; if you cannot, I’d pick Sifflet. The two sit $2,000 apart at the public anchor, so price will not settle it. Bigeye and Anomalo are quote-only, so get both numbers in the same week as Sifflet’s.
How I Reviewed Sifflet
I evaluated the pricing model, documented setup workflow, monitor types, lineage and catalog coverage, AI agents, and deployment options against the needs of a data team choosing an observability platform. My recommendations weigh practical buyer fit and operational effort; they do not represent measured detection accuracy or hands-on usability scores.
Pricing model and product details checked in October 2026.
Should You Choose Sifflet?
I recommend Sifflet if you are a mid-size to enterprise team on Snowflake, BigQuery or Databricks with no catalog yet, or a catalog you want to consolidate, and a BI-heavy stack where knowing which dashboards an incident breaks matters. It also fits teams that want monitors in Git and may need self-hosting later.
I’d be more cautious if you are a small team or on a tight budget, where Soda Free, Metaplane’s free tier, Elementary or GX Core cover the basics for nothing. The same goes if your pipelines run through Informatica Cloud or legacy on-prem systems, or if you already run a full catalog like Atlan or Collibra and only need pipeline observability, where Monte Carlo is the stronger buy.
For the right team, the next step is a demo at Sifflet built around a list of your critical data products. Ask two questions before anything else: how dashboards and pipelines count toward the asset cap, and whether marketplace credits or Snowflake credits apply to your contract.
FAQ
How much does Sifflet cost?
Sifflet publishes no list prices. Plans are sized by monitored assets: Entry up to 500, Growth up to 1,000 and Enterprise above 1,000. The one public figure is a 12-month contract on AWS Marketplace at $48,000, billed as platform credits.
Is there a free version of Sifflet?
There is no free plan. Sifflet’s site advertises a free trial, but the trial request goes through a contact form, so expect a conversation with the sales team before you get access. Soda Free, Metaplane (10 tables) or Elementary’s open-source package are the free alternatives.
Does Sifflet read my raw data?
Sifflet connects with read-only grants and stores metadata and monitor results, not your source rows. Failing-row samples are pulled on demand and not stored. Each customer gets a single-tenant instance in the US, Europe or Asia, and the AI agents work on metadata only.
Sifflet vs Monte Carlo: which is better?
Sifflet is better if you need a catalog and lineage in the same contract; Monte Carlo is better if you already have a catalog and want the most established pipeline observability. At the public anchor they cost within $2,000 of each other ($48,000 versus $50,000 for 12 months on AWS Marketplace), so the catalog question decides it.
Can Sifflet be self-hosted?
Yes, on the Enterprise plan. Self-hosted deployment runs entirely in your environment and can be air-gapped. Hybrid instead keeps the instance hosted by Sifflet while a lightweight Docker agent reaches databases on your private network, in preview for MySQL, Oracle and PostgreSQL. Entry and Growth are SaaS only.