Editor’s note: This Looker Studio review evaluates Looker Studio (renamed Data Studio in April 2026) and the $9 Pro tier as sold in October 2026: the pricing model, the documented path from a blank report to a scheduled dashboard, and the connector, blending, sharing and Gemini features around it. It is not a hands-on performance test. I weigh pricing and hidden costs, connectors and data limits, ease of building and sharing, governance, and AI features.
Quick verdict: I recommend Looker Studio for marketers, small teams and agencies who report mostly on Google data (GA4, Google Ads, Search Console, Sheets, BigQuery) and want free dashboards. The trade-off: non-Google sources usually need a paid partner connector, blends stop at five sources, and Google Ads and Search Console data refreshes only every 12 hours.
Google announced on April 13, 2026 that Looker Studio would return to Data Studio, its pre-2022 name, and Looker Studio Pro is now Data Studio Pro. I use “Looker Studio” because that is what buyers search for, and Data Studio where Google’s naming matters.
In this review, I’ll take a closer look at Looker Studio’s pricing, connectors, limits and Pro features, so you can see exactly whether it covers your reporting or you’ll outgrow it.
Key Takeaways:
- Looker Studio is free for report creators and viewers
- Data Studio Pro costs $9 per user per project per month, and viewers need no license
- Google lists 1,400+ data sources, but many non-Google connectors are paid partner products (Supermetrics from EUR 39 per month billed yearly)
- Blends cap at five sources and join on equality conditions only
- The free tier allows one email schedule per report, sent at most once a day
Pros and Cons
Pros
- Free for report creators and viewers, Google connectors included
- 1,400+ data sources, with free GA4, Ads, Search Console, Sheets and BigQuery connectors
- Pro costs $9 per user per project per month, and viewers need no license
- Pro content belongs to a Google Cloud project, with team workspaces and four roles
- Conversational Analytics went GA on July 30, 2026 for BigQuery data agents
Cons
- Non-Google sources often need paid connectors (Supermetrics from EUR 39/month)
- Blends max out at five sources, equality joins only
- Google Ads and Search Console data refreshes every 12 hours, fixed
- Free tier: one email schedule per report, daily at most
- Embeds always carry a Data Studio watermark that cannot be removed
How Much Does Looker Studio Cost?
Building and viewing reports is free, and the only paid tier, Data Studio Pro, lists at $9 per user per project per month on Google’s product page:
- Free ($0): for individuals and small teams building reports on Google data
- Data Studio Pro ($9 per user per project per month): for teams that need shared ownership, more schedules and Google Cloud support
- Pro organization subscription (custom): for large organizations, billed by monthly active users of Pro content and set up through a Google Cloud sales specialist
| Plan | Free | Data Studio Pro |
|---|---|---|
| Price | $0 | $9 per user per project per month |
| Who needs a license | Nobody | Creators and editors in Pro workspaces; viewers free |
| Scheduled delivery | 1 schedule per report, daily at most | Up to 200 per report, hourly, Google Chat and Slack |
| Daily email quota | 200 (500 on Google Workspace) | Unlimited |
| Content ownership | Individual Google account | Google Cloud project |
| Support | No dedicated support; community forums | Google Cloud Customer Care, with a separate support plan |
| Gemini in Data Studio | No | Yes, admin-enabled, Preview features |
The Pro trial runs 30 days with no limit on how many users you add, and billing starts automatically afterward unless you cancel. Google bills every license in the subscription each month whether anyone uses it or not, so buy seats for active editors only.
Each subscription ties to one Google Cloud project and its Cloud Billing account, so splitting costs by department takes one project and subscription per unit. Technical support for Pro also needs a separate Google Cloud support plan on top of the $9 license.
Looker customers can claim at least 1,000 complimentary Pro licenses on eligible instances, but not on customer-hosted Looker (original), Looker (original) contracts signed after August 1, 2026, or Looker (Google Cloud core) instances created after that date.
Is Looker Studio Good Value for Money?
Partner connectors bill separately, on top of the free tool:
- Supermetrics: Starter from EUR 39 per month billed yearly (EUR 49 monthly), covering 2 data sources
- Windsor.ai: a Forever Free plan with 1 data source, then Basic at $19 per month billed yearly for 3 sources
- Porter Metrics: priced per connected account, listed at $12.50 per account billed annually
- BigQuery: every uncached query, manual refresh, automatic refresh and scheduled run is billed to the billing project you pick in the connector
Power BI Pro costs $14 per user per month billed yearly, and sharing needs a paid license. Tableau list prices start from around $75 per Creator per month on annual billing.
- Good fit: teams reporting on GA4, Google Ads and Search Console, where every connector is free
- Less convincing fit: agencies pulling many non-Google ad platforms, where Supermetrics Growth alone costs EUR 159 per month billed yearly for 7 sources
- Budget priority: solo marketers and small businesses, who can stay on the free tier with no time limit
Reviewer’s Notes: Stay on the free tier until you need reports that survive an employee leaving, or more than one daily schedule per report. At that point Pro is cheap: a five-editor agency pays $45 per month for one project, and every client who only views reports stays free. Put the subscription in a dedicated Google Cloud project, as Google recommends, so the license bill stays separate from other project spend.
Getting Started With Looker Studio
Creating My First Report
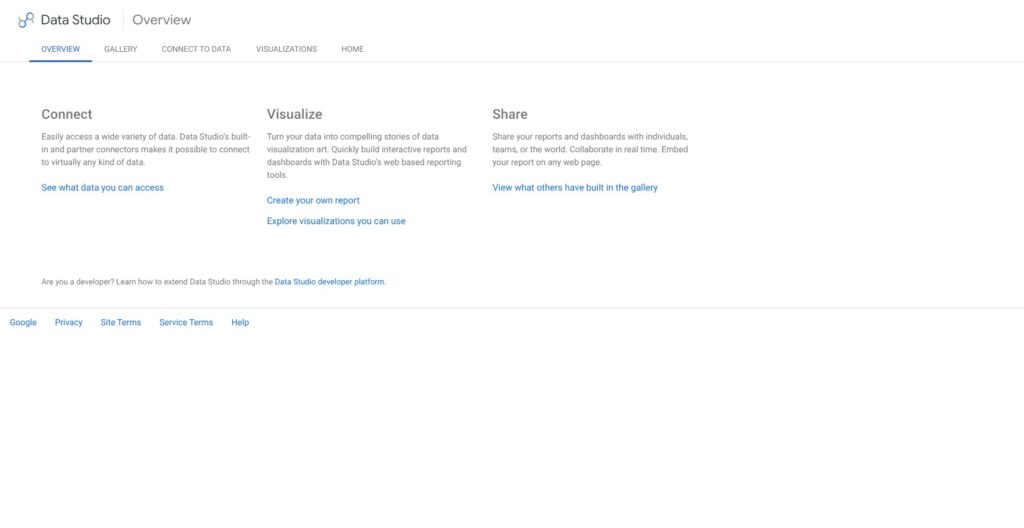
Signing in at datastudio.google.com with any Google account opens a home page listing every report I can access. Create > Report opens the editor with the Add data to report panel showing.
- Pick a connector: Google Sheets, Google Analytics or BigQuery, for example, then authorize access when prompted
- Choose the data: select the account, property, project or table and click Add, and a table lands on the canvas
- Model the source (optional): rename fields, add calculated fields or parameters, and set credentials and data freshness
- Add charts: click Add a chart, pick a type, click the canvas, then set dimensions and metrics in the properties panel or by dragging fields
- Add controls: drop in filters and a date range control, then switch to View to see the report as a viewer would
Starting From a Template
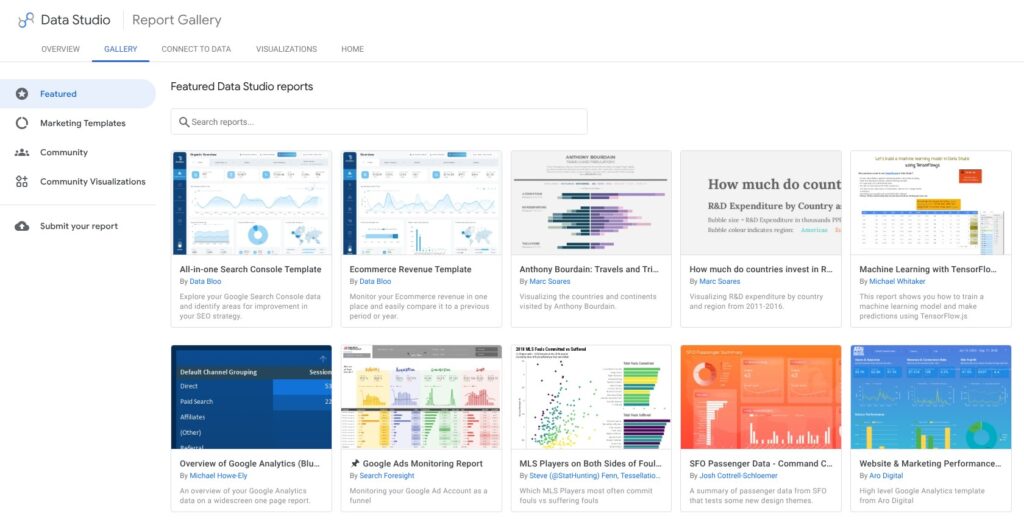
Google’s template gallery covers BigQuery, Google Analytics, Google Ads, Google Sheets, YouTube Analytics, Search Console, Display & Video 360, Search Ads 360 and Apigee. Any report becomes a template when /preview is appended to its URL, so I can share one finished layout and let each recipient copy it onto their own data.
Sharing and Scheduling
Share works like a Google Doc: I add people or Google Groups. Sharing a report does not share its data source, and the data credentials decide what each viewer sees:
- Owner’s credentials: viewers see data through the owner’s access, the default for BigQuery
- Viewer’s credentials: each viewer needs their own access to the underlying data
- Service account credentials: a Google Cloud service account holds the access
Scheduling sits under Share > Schedule delivery. Free accounts get one schedule per report, at most once a day, with no Send now and no custom subject or message, and an individual account can send 200 scheduled emails a day (500 on Google Workspace). Pro raises that to 200 schedules per report, hourly delivery, unlimited emails, and Google Chat and Slack destinations. Reports in the “Owned by me” folder keep the free limits even for Pro users.
Users in Google’s community forum have reported free-tier schedules set for 2:00pm arriving at 2:20pm, 2:30pm or 3:00pm since 2023, with no dedicated support to escalate to.
Top Tip: Check the credentials before you share a BigQuery-backed report publicly. With owner’s credentials, anyone who opens the link sees data through your access, and every query they trigger is billed to the billing project you picked in the connector.
Connectors, Data Blending, and Data Freshness
Google lists more than 1,400 data sources for Looker Studio, including over 1,300 community connectors. Google-built connectors are free; community connectors may cost money, and their problems go to the partner that built them.
Connectors
Google’s own connectors cover GA4, Google Ads, Search Console, Sheets, BigQuery and YouTube Analytics, plus MySQL, PostgreSQL and SQL Server databases and CSV uploads. The Looker connector adds one Looker Explore per data source, always uses viewer’s credentials, and caps query results at 75,000 rows.
The GA4 connector draws on the Google Analytics Data API quota for the property: 200,000 core tokens per day, 40,000 per hour and 10 concurrent requests on a standard property, rising to 2,000,000 per day on Analytics 360. Every report and tool hitting the same property shares that quota, which is why one user in Google’s community forum saw quota errors on more than 20 dashboards at once.
Partner connectors carry their own risk: users reported every community and partner connector failing together with a “Your Admin has restricted access to these connectors” error, and Google staff confirmed they were working on a fix. Funnel’s status page logged a separate Looker Studio connector outage on April 9, 2026.
Blending
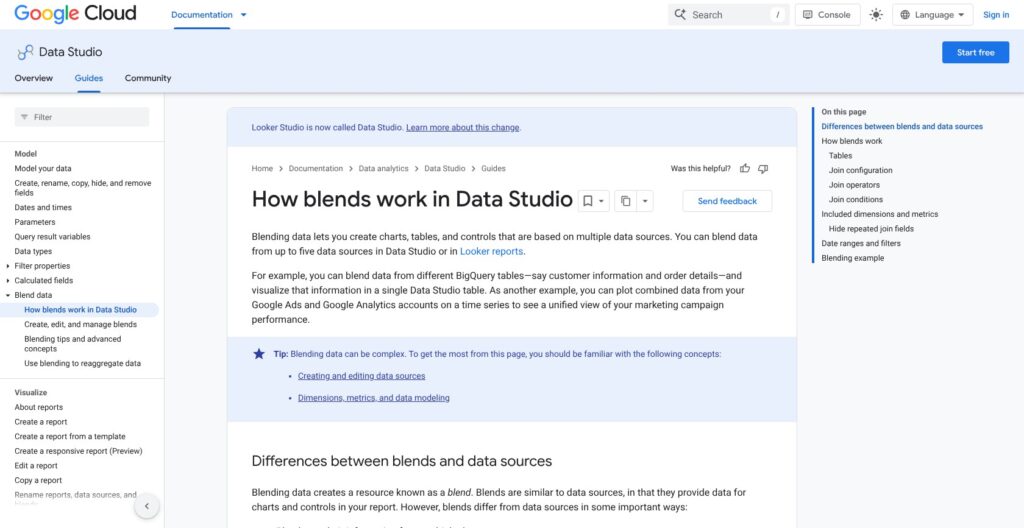
A blend joins up to five data sources with inner, left outer, right outer, full outer or cross joins, on equality conditions only. Blends live inside the report where I build them, cannot be reused in another report, and refresh only as often as their slowest source. Rows are grouped by the selected dimensions before the join, so without a unique ID field, rows can collapse. For modeling beyond five equality-joined tables, Google’s own route is Looker’s LookML semantic layer, which Data Studio reads through the Looker connector.
Freshness and Extracts
Google Ads, Search Console and YouTube Analytics data refreshes every 12 hours, and that interval cannot be changed. Google Analytics also defaults to 12 hours, with 1 or 4 hours as the only faster options. Sheets defaults to 15 minutes, and BigQuery and SQL databases accept 1 to 50 minutes or 1 to 12 hours (default 12). For slow sources, the Extract Data connector snapshots up to 750,000 rows (larger extracts are truncated) and fails above 100 MB, refreshed on a schedule with Auto update. CSV uploads cap at 100 MB per dataset and 2 GB per user.
Calculated Fields, Charts, and Embedding
Calculated fields can live on the data source, where every chart built on it reuses them, or on a single chart, and the function list covers aggregation, arithmetic, conditional logic, dates, geo, text and regular expressions. Parameters act as variables: a control, the report link or a default value can feed them into a calculated field, a BigQuery custom query or a community connector. Filter-control defaults have accepted parameters since November 13, 2025.
Google’s release notes list these report-builder additions:
- Cross data source filtering, a histogram chart and per-viewer hidden components: January 15, 2026
- Viewer data refresh: June 18, 2026, so viewers can refresh when an editor allows it
- Fullscreen charts, rotated components and copy chart as image: August 13, 2026
- Bulk series styling: September 24, 2026
Responsive reports are listed as a Preview feature.
Embedding works on any site that accepts an iframe, on Google Sites, and through oEmbed, and private reports require viewers to be signed in to Google. Embedded reports are view-only, cannot be refreshed manually, and always show the Data Studio watermark and fullscreen link, which cannot be removed. Agencies that need branded client reports should look at Whatagraph, whose Max plan (from EUR 999 per month billed annually) includes white-label reports.
Any data source can filter rows by the signed-in viewer’s email address. On BigQuery, a custom query using @DS_USER_EMAIL returns only that person’s rows, and @DS_START_DATE and @DS_END_DATE pass the report’s date range into the SQL, so one report serves each viewer their own data without separate copies.
Data Studio Pro, Governance, and Gemini Features
Ownership and Team Workspaces
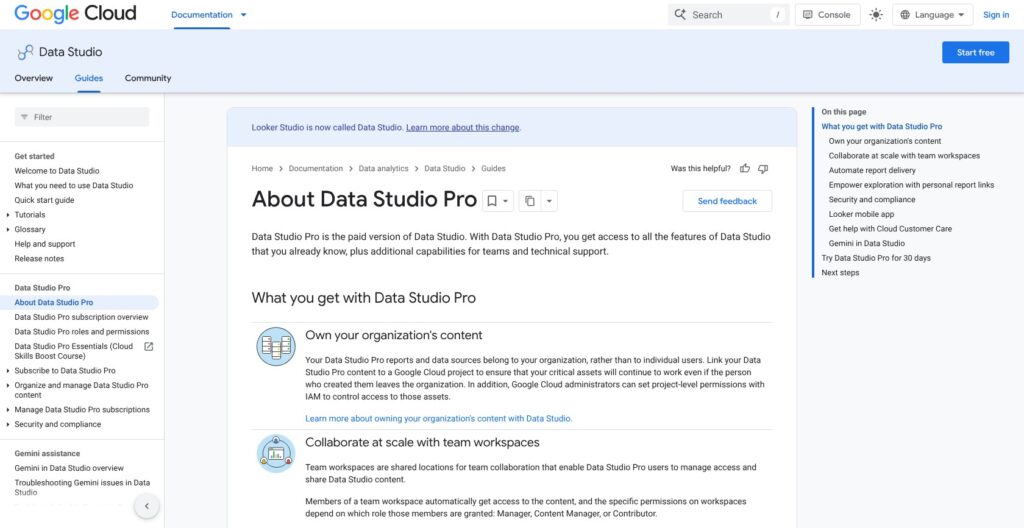
Pro moves reports and data sources from individual Google accounts into a Google Cloud project, which addresses the free tier’s orphaned-report problem. Users in Google’s community forum describe reports stuck on a “Request access” page after the owner’s Workspace account was deleted, where restoring the account did not always bring them back and a support case was the only route. Transferring ownership beforehand works, but it does not move the underlying data sources.
Team workspaces add four roles (Manager, Content Manager, Contributor and Viewer), with project-level IAM permissions on top. Pro activity has been logged in Google Cloud since November 6, 2025, and on June 11, 2026 Pro added:
- CMEK: customer-managed encryption keys
- Customer-managed storage: uploads in your own Cloud Storage bucket, extracts in your own BigQuery dataset
- Data residency: control over where Pro data is stored
Pro also includes alerts, personal report links, the Looker mobile app and Google Cloud Customer Care access. Since February 2026, admins can buy Pro from the Google Workspace Admin console and switch its billing account without interrupting access.
Gemini and Conversational Analytics
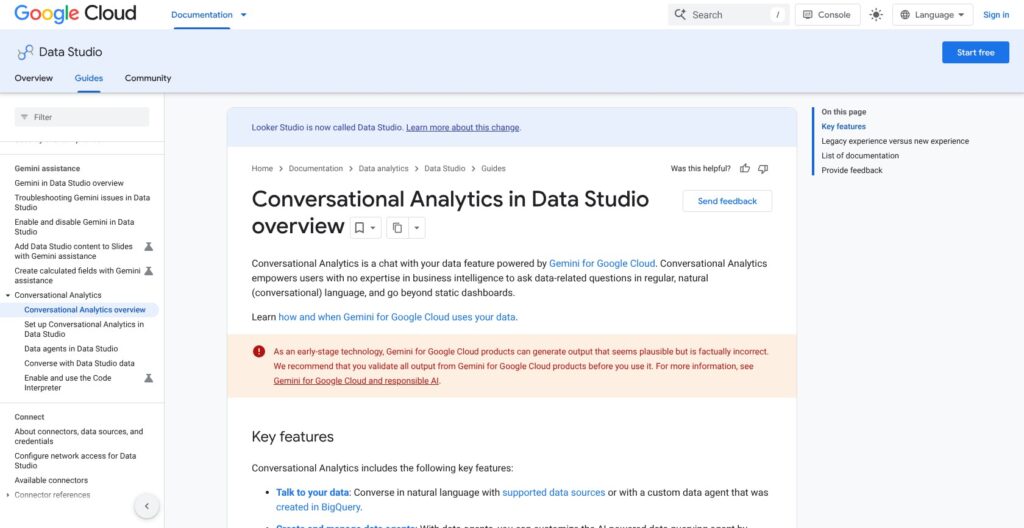
Gemini in Data Studio needs Pro and an admin to switch it on. It brings two features, both labeled Preview: natural-language calculated fields (“Help me write”) and Generate Slides, which turns report charts into a deck. Google says both are free “for a limited time only” and may carry an extra fee later.
Conversational Analytics went generally available on July 30, 2026 and no longer requires Gemini, so every Data Studio user can ask questions in plain language. The agents come from BigQuery: since April 16, 2026, data agents can no longer be created inside Data Studio, only built by a technical user in BigQuery and consumed here. On the Looker platform, the same feature is metered in data tokens, at $3.00 per million input and $20.00 per million output tokens once overage enforcement starts; Data Studio’s documentation states no such metering.
I would not buy Pro for the AI today: both Gemini features are Preview, and Conversational Analytics is open to free users anyway. Buy it for ownership and scheduling.
How Does Looker Studio Compare to Competitors?
Looker Studio and self-hosted Metabase are the only options here that cost $0 for both report builders and viewers:
- Power BI: Pro costs $14 per user per month billed yearly and Premium Per User $24, and sharing needs a paid license unless the organization runs Fabric capacity. A Fabric capacity reservation saves 40.5% over pay-as-you-go, but some activities still need per-user licenses. Power BI wins for organizations already paying for Fabric capacity, where sharing no longer needs a Pro license per viewer.
- Tableau: list prices start from around $75 per Creator per month on the Standard edition, with Explorer around $42 and Viewer around $15, and every deployment needs at least one Creator. Tableau suits enterprise BI teams that budget per role, with an Enterprise edition from around $115 per Creator.
- Looker: Google’s enterprise platform is quote-only on one to three year commitments, and every edition includes 10 Standard Users and 2 Developer Users. Its Conversational Analytics comes with monthly token quotas (60 million input tokens on Standard). Looker wins when you need a governed LookML semantic layer, and Looker Studio can read its Explores through the Looker connector.
- Metabase: the open-source edition is free with unlimited users if you host it yourself. Starter costs $100 per month ($90 billed yearly) for the first 5 users, then $6 per extra user, and Pro costs $575 per month for the first 10 users. Metabase wins for SQL teams that want to self-host.
- AgencyAnalytics and DashThis: AgencyAnalytics charges $20 per client per month billed annually after a 14-day trial, and DashThis starts at $44 per month billed yearly for 3 dashboards and 15 sources, or $139 for 10 dashboards. Both win for agencies that want a dedicated client reporting product priced per client or per dashboard, not Looker Studio plus a partner connector.
| Tool | Starting price | Viewer cost | Best for |
|---|---|---|---|
| Looker Studio | $0; Pro $9 per user per project per month | Free | Google data, zero license cost |
| Power BI | $14 per user per month (Pro, yearly) | Paid license unless on Fabric capacity | Fabric capacity customers |
| Tableau | From around $75 per Creator per month | Viewer license around $15 | Per-role enterprise licensing |
| Looker | Quote only | Viewer user type, quote only | Governed semantic layer |
| Metabase | $0 self-hosted; Starter $100 per month | Free self-hosted; cloud counts users | Self-hosting, SQL teams |
| AgencyAnalytics | $20 per client per month (yearly) | Priced per client | Per-client agency reporting |
| DashThis | $44 per month (yearly) | Priced per dashboard | Small agency dashboards |
Looker Studio still wins when most of your data lives in Google products: GA4, Ads, Search Console and BigQuery connect free, viewers never need a license, and Pro at $9 per editor per project undercuts Power BI Pro by $5 per seat.
How I Reviewed Looker Studio
I evaluated Looker Studio and Data Studio Pro against five areas: pricing and hidden costs, connectors and data limits, ease of building and sharing, governance, and AI features. I mapped the documented path from a blank report to a shared, scheduled dashboard, then weighed the limits that decide when a team outgrows the free tier: five-source blends, 12-hour refresh on Google Ads and Search Console data, one schedule per report and 100 MB extracts.
I priced the partner connectors a non-Google source needs (Supermetrics, Windsor.ai, Porter Metrics) and set Looker Studio against Power BI, Tableau, Looker, Metabase, AgencyAnalytics and DashThis on price and the niche each wins. I also weighed recurring complaints from users in Google’s community forum: GA4 quota errors, late scheduled emails and orphaned reports. This is not a hands-on performance test, so I make no load-time or speed claims.
Prices current as of October 2026.
Should You Build Your Dashboards in Looker Studio?
Yes, if most of your data already lives in Google products. Looker Studio connects GA4, Google Ads, Search Console, Sheets and BigQuery for free, lets anyone view reports without a license, and charges $9 per editor per project only when you need Pro’s shared ownership and scheduling. Its limits sit at the edges: five-source blends, 12-hour refresh on Google Ads and Search Console data, paid partner connectors for everything else, and a watermark on every embed. Users in Google’s community forum also hit GA4 quota errors when several tools share one property.
Recommended if:
- You’re a marketer or small business reporting on Google data
- You run an agency with a few editors and many client viewers, where Pro costs $9 per editor and clients stay free
- You run BigQuery and want a free front end with row-level filtering
Not recommended if you need:
- Modeling beyond five-source blends, or a governed semantic layer: pick Looker
- Sharing across a Microsoft Fabric estate: pick Power BI
- White-label client reports: pick Whatagraph
- Self-hosting: pick Metabase
Start free at datastudio.google.com from one of Google’s GA4 or Google Ads templates, and add Pro only when a second editor needs shared ownership or a report needs more than one daily schedule.
FAQ
Is Looker Studio free?
Yes. Looker Studio (now Data Studio) is free for report creators and viewers, and Google’s own connectors for GA4, Google Ads, Search Console, Sheets and BigQuery cost nothing. You pay only for the optional Pro tier at $9 per user per project per month, for partner connectors such as Supermetrics, and for the BigQuery queries your reports run. See How Much Does Looker Studio Cost? above for the full breakdown.
Is Looker Studio now called Data Studio?
Yes. Google announced on April 13, 2026 that Looker Studio would return to the Data Studio name it used before 2022, and Looker Studio Pro became Data Studio Pro. Existing reports, data sources and users carried over automatically, and lookerstudio.google.com now redirects to datastudio.google.com.
How much does Looker Studio Pro cost?
Data Studio Pro costs $9 per user per project per month, billed monthly through a Google Cloud billing account. Only creators and editors need a license, and viewers are free. Google bills every license whether used or not, offers a 30-day trial with unlimited users, and sells a monthly-active-user subscription to large organizations through its sales team.
What is the difference between Looker and Looker Studio?
Looker is Google’s enterprise BI platform, sold through sales on one to three year contracts and built around the LookML semantic layer. Looker Studio (Data Studio) is the free, self-serve report builder for dashboards on Google and partner data. The two connect: the Looker connector brings Looker Explores into Data Studio, capped at 75,000 rows per query.
Why does my Looker Studio GA4 report show quota errors?
Your report hit the property’s Google Analytics Data API quota: 200,000 tokens per day, 40,000 per hour and 10 concurrent requests on a standard GA4 property. Every tool querying that property shares it. Fewer charts and filters per page, report-level caching, an Extract Data source, or a GA4 export to BigQuery all lighten the load on the property.