There are differences in the syntax required when using SQL that will depend on where your data warehouse is built. For more information see the documentation for Google BigQuery or Redshift.
The Panoply workbench, accessible by clicking Workbench in the navigation menu, is a web-based sandbox for testing and running queries. You can also save your queries as views in order to reuse them in this workbench, an external workbench, a visualization tool, or any analytics tool that you want to connect to Panoply.
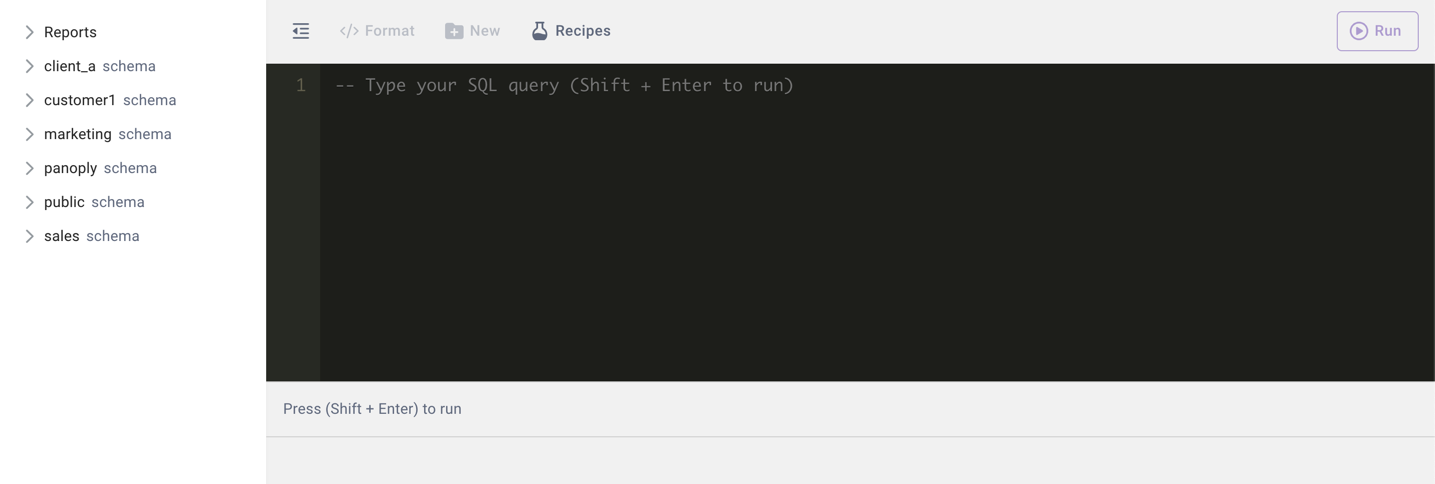
The workbench consists of:
- Query area: Any valid SQL syntax will work here. To execute your query, click the Run icon above the query area, or press Shift + Enter. Additionally, highlight part of the query to only run that part.
- Table list: Your tables and views are organized by schema. Expand a table or view to view the list of related fields.
- Results :The results of your executed query appear here.
You can adjust the height of the query area and the results area. You can show or hide the table list by clicking the grid icon above the query area.
Users can switch between SQL and Panoply's query builder. When switching from SQL to the query builder, the latest query builder's query will be loaded. When switching from the query builder to SQL, the SQL version of the query you built will load in the SQL workbench.
Query Builder
Panoply's query builder allows a point and click option to ask questions on top of your data. You start by dragging and dropping columns from the table list to query area.
Once columns were dragged into the query, you can select any of the following options by right-clicking on the selected columns:
- Functions - Select any of the available functions to aggregate your result. Any column that was not set with a function will be set a a dimension in the result
- Filter - Define filters before or after functions are applied
- Order - Define the order of the results
- Hide column - Hides the column from the result. This option is helpful when looking to filter the results based on a certain column without showing it in the result itself.
- Alias - Rename a column in the result
- Duplicate column - Duplicates the existing column. If the column has function applied on it, the function will be duplicated as well.
- Remove column - Removes a column from the result. This action will remove also any filter or other functionality set on the removed column.
From the query builder's menu, you can do the following:
- Clear query - Reset the query builder
- Undo change
- Redo change
- Filter query - Edit the current filters or add new filters. Users can defined multiple filters including complex relationship between the filters with AND/OR and parentheses between the different filters
- Join query - Join multiple tables together to expand the result to include data from more than a single table. Choose the join type and condition. Dragging columns from multiple tables will trigger the join operation as well.
- Order query - Set the order of the result based on any of the existing columns in the result
- Show/hide hidden - Show or hide hidden columns. This is helpful to see exactly which columns are part of the query.
- Limit - Define the maximum number of rows to return from the query
Workbench Menu
Apart from executing queries, the workbench's functionality is accessed through three menus:
-
Workbench toolbar:
- Format: Formats the written query in standard SQL format.
- New: Clears the query area and the results area so you can start a fresh query.
- Recipes: Opens the recipes menu with available recipes for your account
-
Entities' three dots menu:
- Open
- Reports and views - Opens the definition and runs the query
- Tables - Runs a
SELECT *query on the table
- Manage viewers - Define which viewer can access which entity. Not available for reports.
- Delete - Deletes the entity from the Panoply account
- Open
-
Result's actions:
- Save - Save changes to the latest opened report/view or save as new
- Export - Save the results as a .csv file. For more detail, see Exporting Data
- Copy - Copy the SQL query or the results from the current page to the clipboard to the clipboard
When running multiple queries, users can cycle between the different results to export or save them separately
Exporting Data
From the Workbench page, you can export the results of an executed query or view as a .csv file. This approach is ideal for relatively small results because of the following limitations:
- Redshift:
- The number of returned rows is limited to 1M.
- The output file size is limited to 100MB.
- BigQuery:
- The number of returned rows is limited to 1M.
- The output file size is limited to 1GB.
To export data:
- Run the desired query to verify the results.
- Click the arrow icon above the results and select Export.
- Do one of the following:
- Stay on the Workbench page until the results file is generated and the download occurs.
- Navigate elsewhere in the Panoply platform, and download the file later from the Jobs page. Click the cloud download icon to download the results file.
- You can use the filters to select only the Export items.
In Redshift: You can also use the UNLOAD command with a SELECT statement to unload data from database tables to a set of files in an Amazon S3 bucket. This approach can handle result sets larger than 100 MB. However, be aware that the Amazon S3 bucket where Redshift writes the output files must be in the same region as your Panoply deployment, which is most commonly in the us-east-1 region. To learn more, reference the UNLOAD command documentation, see some UNLOAD examples, and read about Unloading Data to Amazon S3 in the Redshift Database Developer Guide.
Visualizing results
In Panoply's workbench, users can transform the result of a query into reports.
Panoply supports five different reports:
- Table - Any query can be visualized as a table with the following configurations available:
- Color Palette - Select one of five available palettes
- Show borders - Select if the table chart will have borders or not
- Single Value - The result must be a single numeric value. Users can configure the chart with the following options:
- Value type - Select the format out of the following options:
- Number (100,000)
- Short number (100K)
- Currency ($100,000)
- Short currency ($100K)
- Percent (10%)
- Threshold -Enter a numeric threshold
- Positive threshold - Select to color the value in green if greater than the threshold defined above
- Negative threshold - Select to color the value in red if smaller than the threshold defined above
- Value type - Select the format out of the following options:
- Pie Chart - The result must have 2 columns and the second column must be numeric.
Pie chart will show up to 6 slices. If there are more than 6 slices, the sixth will combine all the data into Other
- Column Chart - the result must have 2-4 columns and the second, third and fourth must be numeric
- Line chart - the result must have 2-4 columns and the second, third and fourth must be numeric
Every result can be saved as a report for easier future access. The saved report will retain the selected report type.