Data Structure
After you collect your data into Panoply, your data will be organized into one or multiple tables within a schema. The default schema will depend on whether you choose Google BigQuery or Amazon Redshift as your data warehouse. For Google BigQuery, the default schema is panoply. For Redshift, the default scheme is public.
Within that schema, Panoply organizes your data into one or more tables.
Tables
To view the collected data, click Tables in the navigation menu. You can sort this list of tables by name, size, schema and row count.
For data warehouses built in Amazon Redshift, the count of Table Rows includes rows deleted today. Our automated process permanently removes deleted rows once per day. For data warehouses built in Google BigQuery, deleted records are culled in real time.
When you click on a table, you can see the following:
- Data: At the top of the page is a sample of the table’s data so that you can get a feel for its structure. Panoply also generates additional fields for each table to denote when each row was last retrieved from the source (
__senttime) and when the row was last written into Panoply (__updatetime), among others. Starting July 2024, BigQuery accounts' tables will generate also when each row was originally written into Panoply (__createtime).
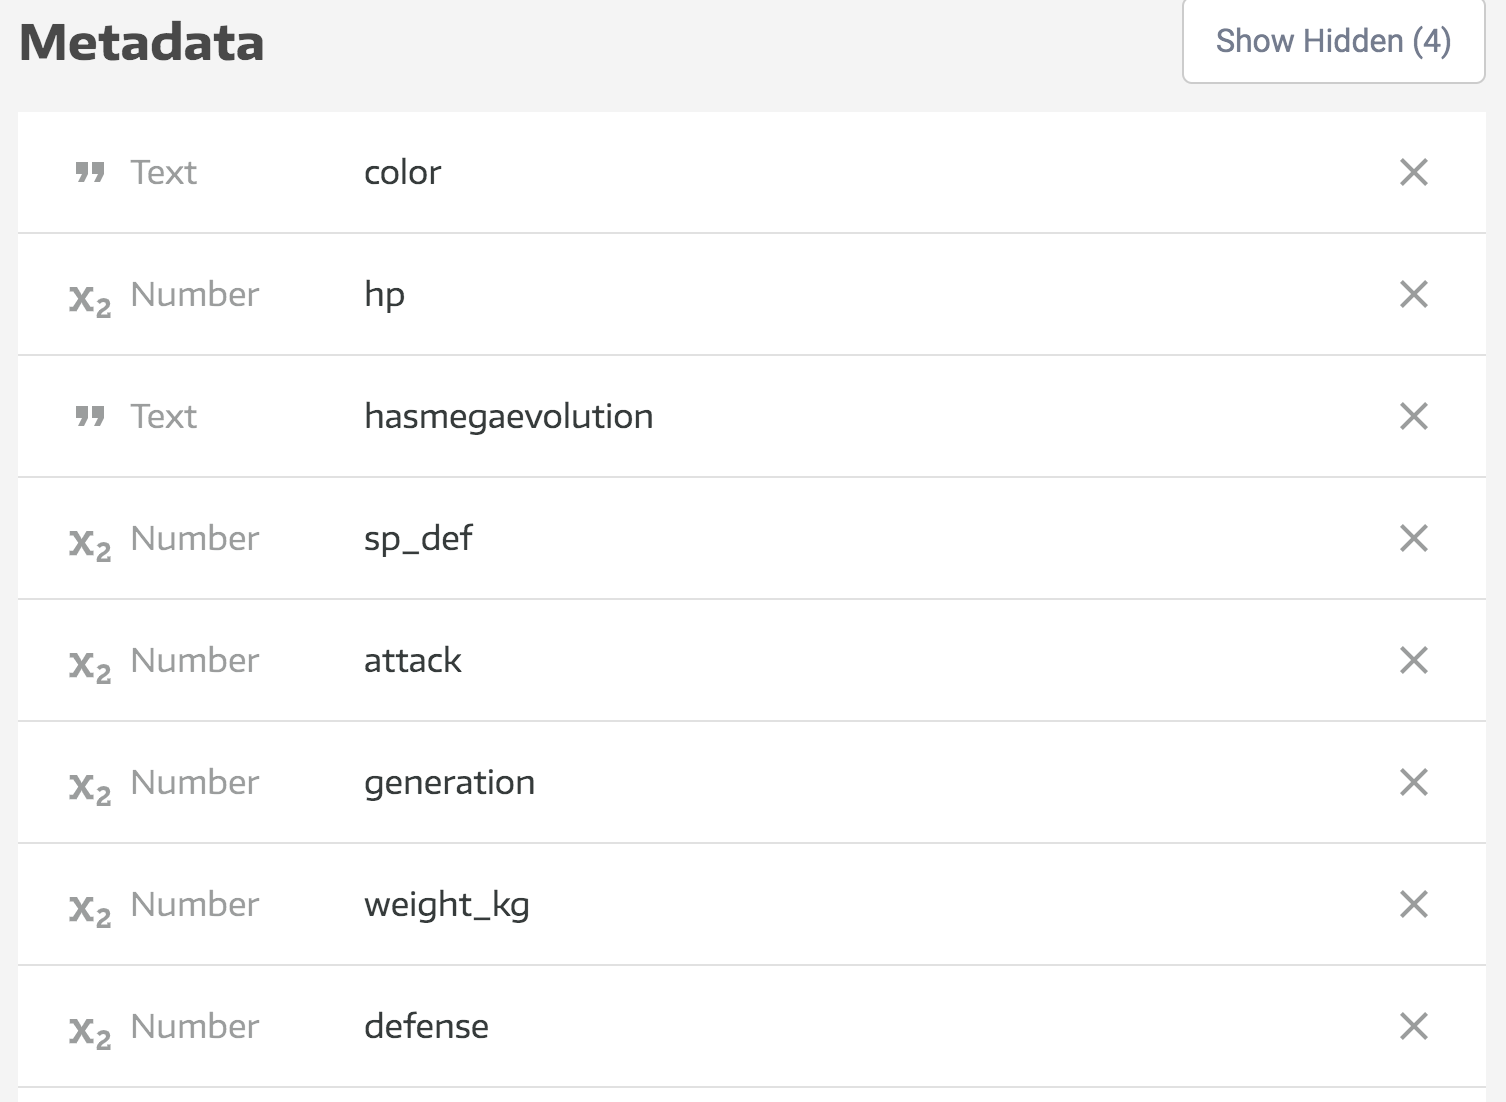
See the data sources documentation for your data source to see what metadata fields are added to those tables. - Metadata: This contains the list of the table’s columns and their data types. Clicking on the fields will allow you to further configure each field.
Subtables
When Panoply collects data from a connected data source, it will generate a table, or multiple tables, in your data warehouse that will contain all the data from that data source.
There are several reasons why Panoply might create multiple tables from a single source. The most common is that the data source has multiple endpoints that all serve different segments of your data. For example, if you collect data from Facebook Ads, you’ll see at least three tables in your Panoply data warehouse after the collection is finished: Insights, Ads and Adsets. That’s the way the data is organized when the Facebook API provides the data, and we try to make sure that the structure is preserved, as closely as possible to the source.
Another common way for multiple tables to be created from a single data source involves subtable creation from nested data. Panoply is designed to optimize your data for analysis, which means that all data points need to be put into standardized tables. For many data sources, like CSVs and MySQL databases this is just a matter of porting over whatever table structures already exist. However, if your data source is a NoSQL database or an API that serves nested JSON, Panoply will automatically unpack the nested objects into their own tables.
In practice, this means that ingesting from these types of sources will create multiple, smaller tables in your Panoply data warehouse. Twitter makes for a great example of nested object flattening. When Panoply collects data from Twitter, which serves its data in highly nested structures, it will create multiple subtables. The table twitter_tweets will also generate twitter_tweets_user, twitter_tweets_retweeted—and multiple other tables—as the nested objects are each extracted and collected into their own tables.
This is Panoply’s default behavior, but you can opt to turn on table flattening if you want to avoid table proliferation. This will unpack nested data directly into columns in its parent tables, rather than creating new subtables. For more detailed information on how Panoply deals with nested data, check out the docs page.
Tables and data types
On the Tables page, you can look at the metadata, which will show you the data types for each column.
Select a table you’d like to modify or explore in more depth to view the table’s columns and associated Metadata.
Clicking a column header from the Metadata view allows you to dig deeper into the table’s inner structure. If your data warehouse is built in Redshift, you can also rename the column, delete it, and change its type or other technical details.
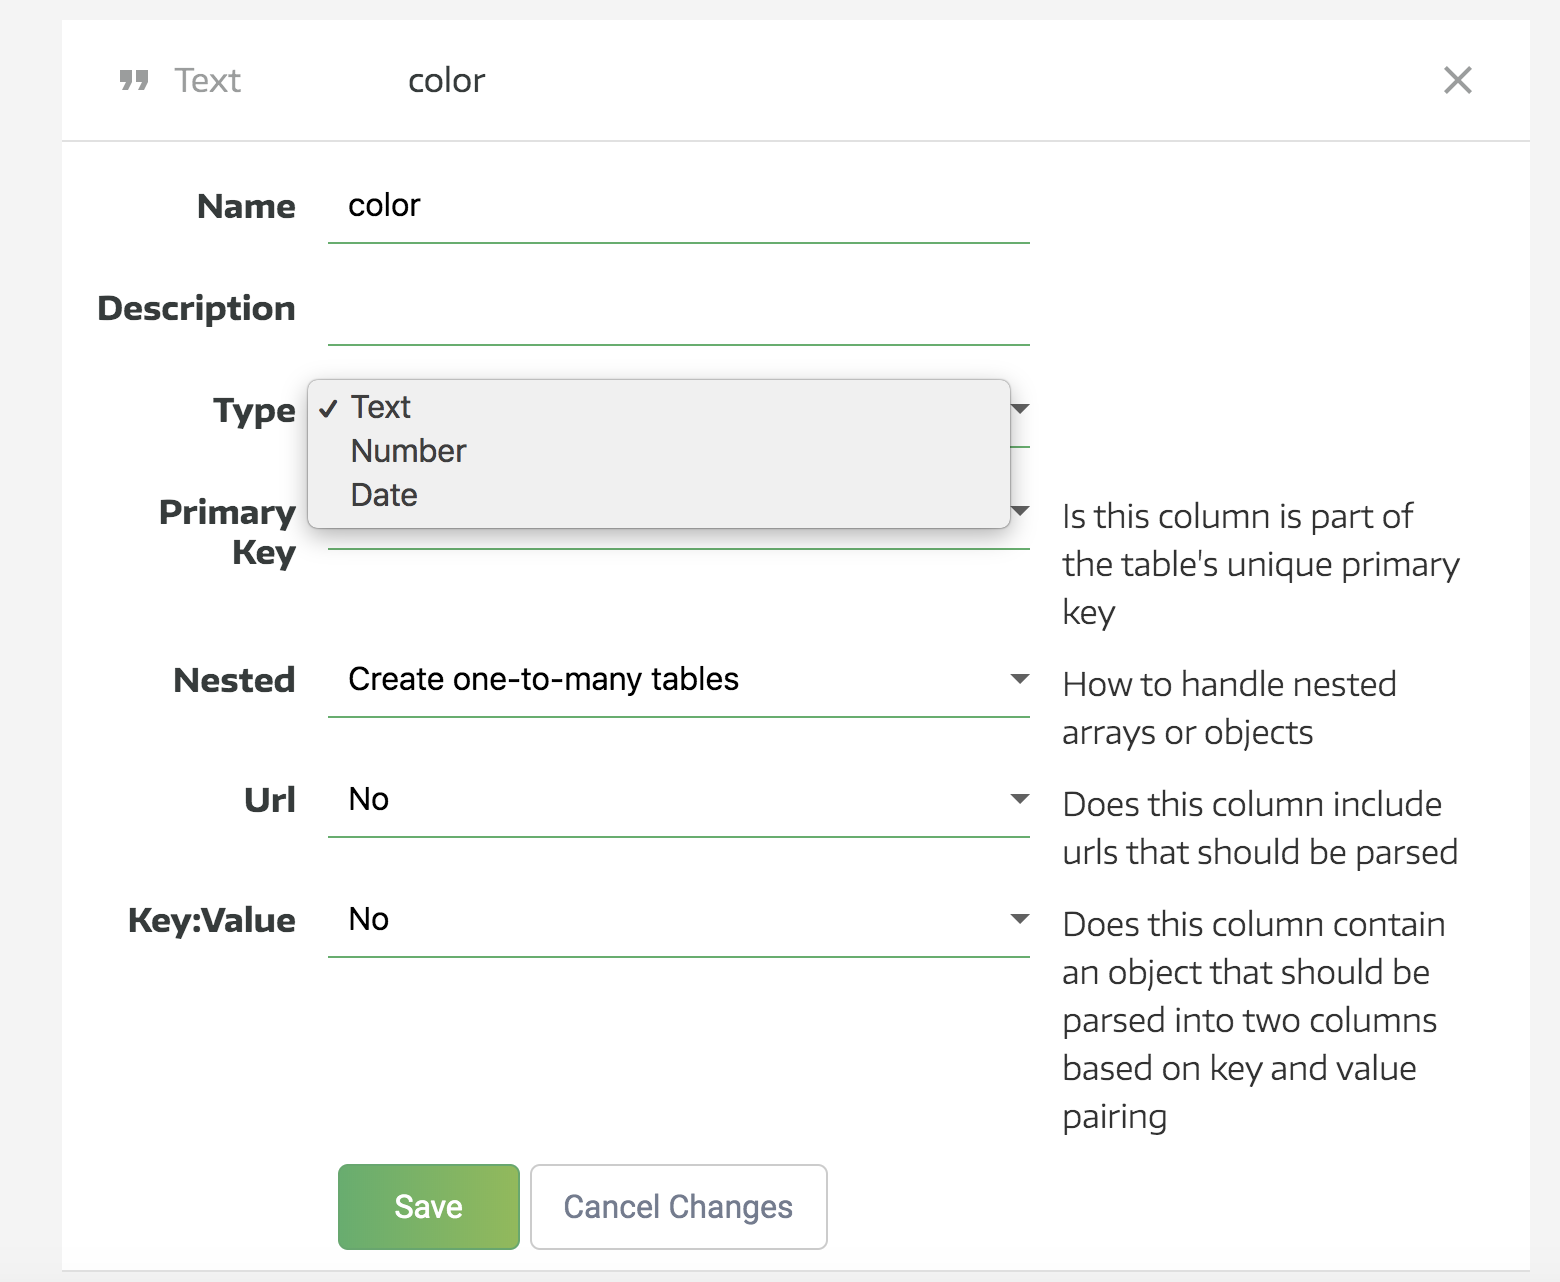
Generally, there’s no need to change these values because Panoply automatically assigns them for you.
Job Management
To track your job progress, select Jobs from the navigation pane. You can filter the jobs list according to status (All Statuses, Pending, Running, Error, Success, and Error) and job type (All Types, Collect, Collect-Direct, Alter, and Export).
Remember to save your changes.
If you'd like to take your Panoply data warehouse to the next level, be sure to set up a data review with a member of our Data Architect Team