
Editor’s note: Our research-based Microsoft Power BI review evaluates reporting, licensing, data modeling, and AI for business buyers.
Quick verdict: I recommend Microsoft Power BI for teams that have outgrown spreadsheet reports and already work in Microsoft’s ecosystem. Its combination of data preparation, reusable calculations, and interactive reporting makes the low Pro price appealing. The catch is that sharing and AI introduce licensing decisions that deserve as much attention as the dashboard builder.
Key Takeaways
- My strongest recommendation is for Microsoft-based teams that want consistent reporting across departments.
- Power BI Pro costs $14 per user per month, paid yearly, while Premium Per User costs $24 on the same basis.
- Free authoring does not mean free private sharing: your audience can need paid licenses too.
- Copilot requires eligible paid capacity; buying Pro or Premium Per User alone does not unlock it.
- Power Query and DAX give analysts room to grow, but creating trustworthy models takes more work than arranging charts.
I’ll cover the costs, reporting workflow, and features I’d weigh before putting a team on the platform.
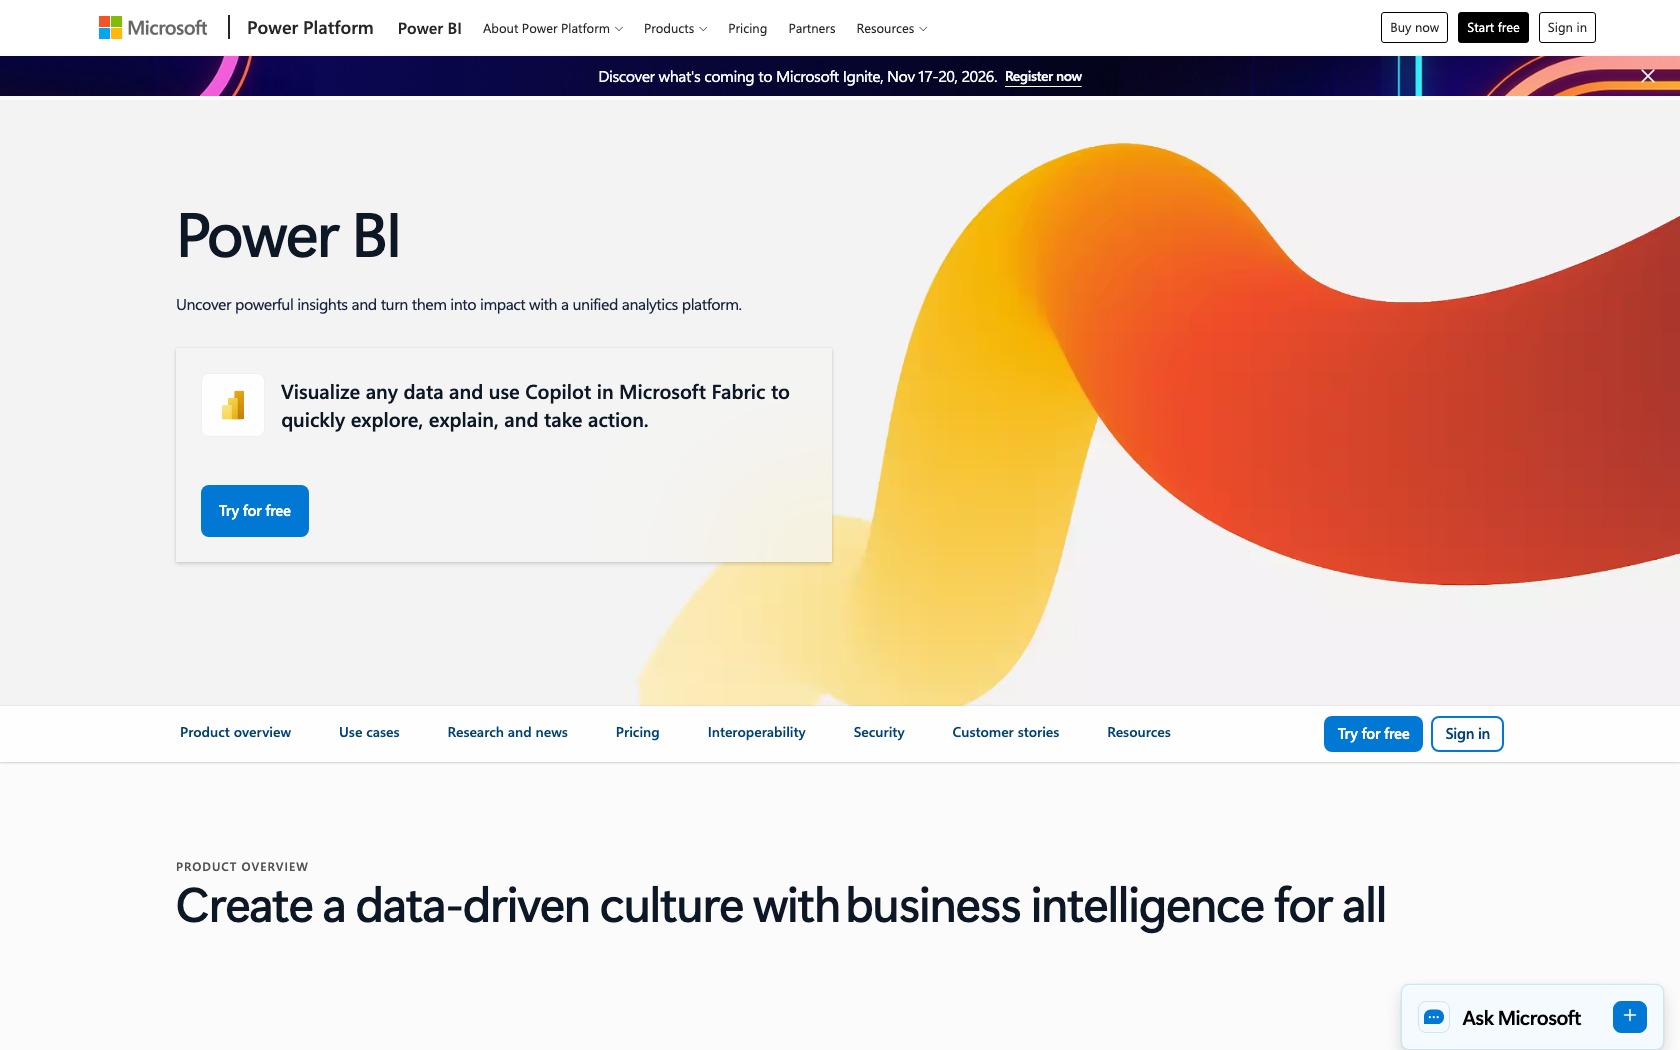
Microsoft Power BI Pros and Cons
Pros
- Free Desktop app for building and evaluating reports
- Power Query combines data preparation with report development
- DAX supports reusable business calculations
- Interactive reports support drillthrough into relevant details
- Pro is included with Microsoft 365 E5 and Office 365 E5
Cons
- Power BI Desktop has no native Mac version
- Private report viewers can need paid licenses
- Copilot adds capacity and administration requirements
- DirectQuery performance depends on the underlying source
- Local data connections can require gateway maintenance
How Much Does Microsoft Power BI Cost?
Pro is the plan I’d start with for a small reporting team. Premium Per User makes sense when you need its larger model allowance or more frequent refreshes.
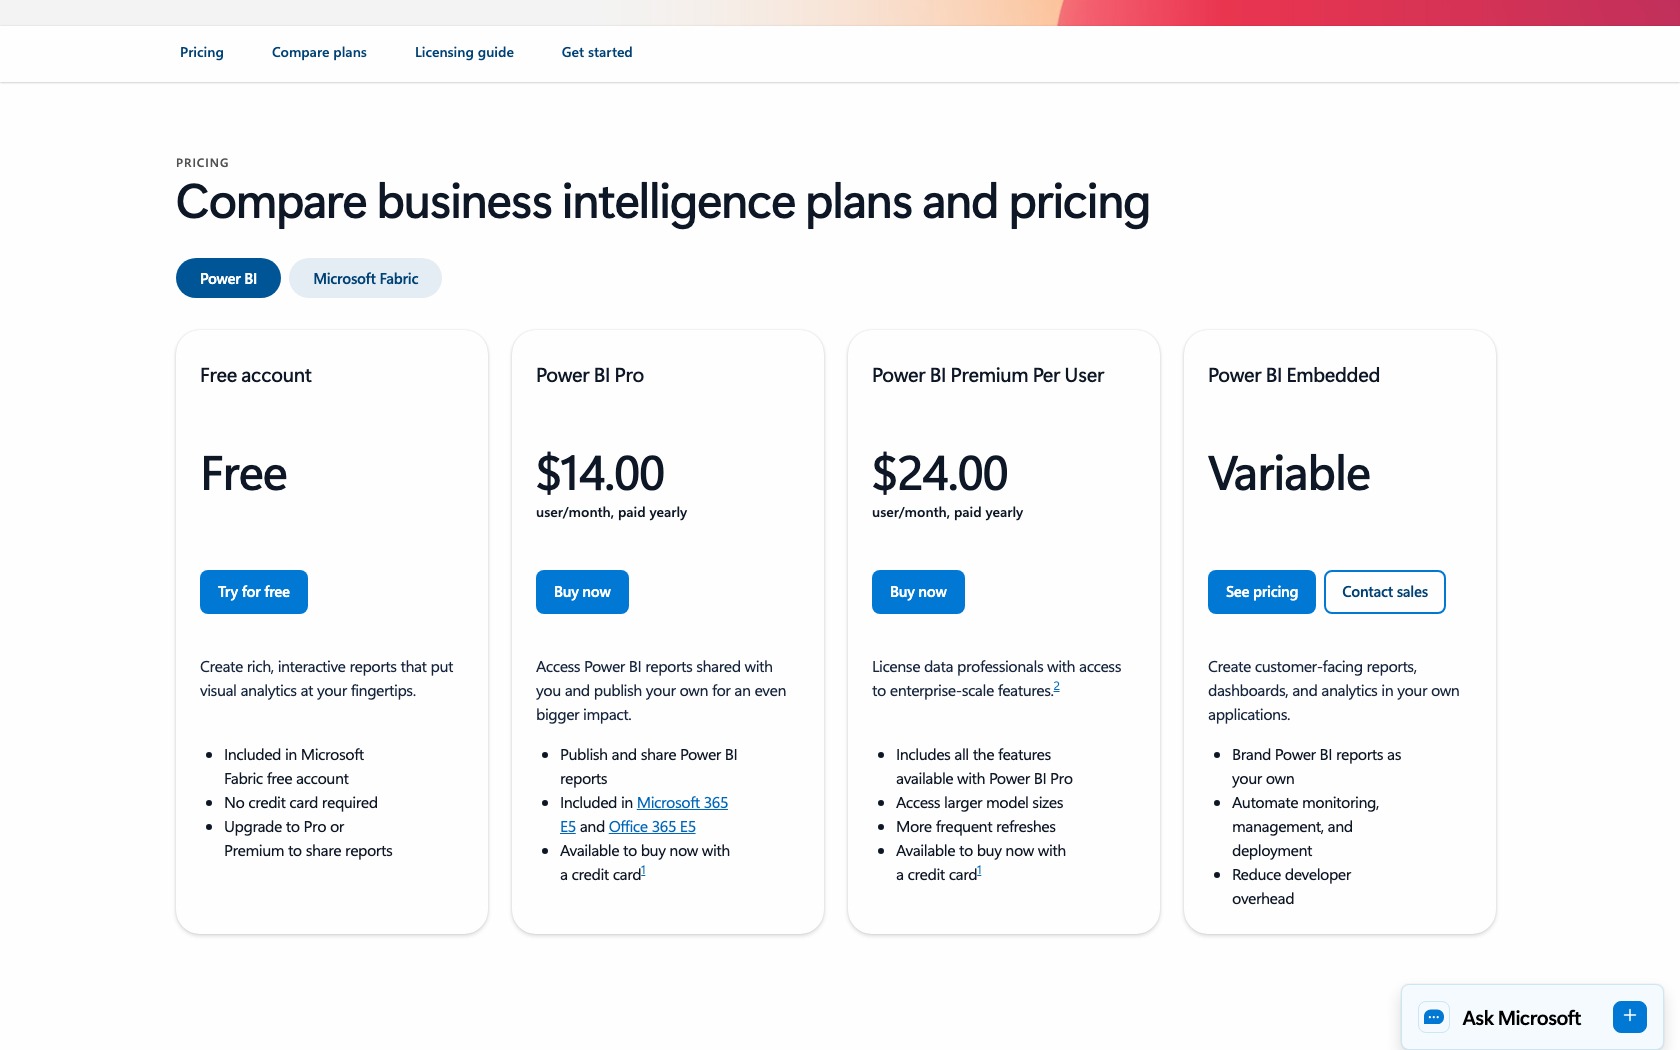
- Free ($0): for learning, Desktop report creation, and personal reports in the online service.
- Pro ($14 per user/month, paid yearly): for publishing and sharing ordinary team reports.
- Premium Per User ($24 per user/month, paid yearly): for teams needing larger models and more frequent scheduled refreshes.
- Microsoft Fabric capacity (variable pricing): for organizations buying shared compute capacity, including eligible Copilot workloads.
| Option | US price | Best fit | Main buying caveat |
|---|---|---|---|
| Free | $0 | Individual report creation | Does not provide ordinary private team sharing |
| Pro | $14/user/month, paid yearly | Small and midsize reporting teams | Budget for consumers as well as authors |
| Premium Per User | $24/user/month, paid yearly | Teams with more demanding models | PPU content requires PPU for its viewers |
| Fabric capacity | Depends on capacity and purchasing terms | Organization-wide analytics workloads | Capacity and individual licensing interact |
The Sharing Cost Is What I’d Calculate First
A team with one author and nine viewers can need 10 Pro licenses. At the annual-payment rate, that is $140 per month equivalent, or $1,680 a year, assuming nobody already has an eligible license.
Check your Microsoft agreement before buying anything. Pro is included in Microsoft 365 E5 and Office 365 E5, which can change the incremental cost considerably. It is not a benefit I’d assume comes with every Microsoft 365 subscription.
Premium Per User has a separate trap: colleagues viewing content in a PPU workspace also need PPU. Upgrading the author alone won’t give the rest of your Pro team access.
Fabric changes the calculation again. F64 or higher supports free-license viewers for Power BI content under the appropriate Viewer permissions. Smaller F capacities do not give you that same distribution benefit, and report creators still need suitable individual licenses.
Is Microsoft Power BI Good Value for Money?
- For an existing E5 organization: I’d check entitlements first. You may already have the licenses for a useful pilot.
- For a small new team: Pro makes the initial purchase manageable, provided you count the whole audience.
- For occasional viewers across a large company: I’d compare total seat costs with capacity before committing.
Reviewer’s Notes: My recommendation is to start with Pro and one recurring business report. Move to PPU when a measured model or refresh requirement justifies it. I wouldn’t buy capacity simply because the AI features look attractive in a demo.
Getting Started With Microsoft Power BI
Power BI is a good step up from recurring spreadsheet reports, but it asks you to learn more than a chart editor. You need to think about how data arrives, what each metric means, and who will maintain the report next month.
The usual Desktop workflow is:
- Connect your data. Start with an Excel workbook or a supported database source.
- Prepare it in Power Query. Correct data types and shape the tables before building visuals.
- Build the model. Establish relationships and define the calculations your report needs.
- Design the report. Arrange visuals around the questions your audience asks.
- Publish to the service. Configure access and refresh so the report remains useful after its first presentation.
I would start with one monthly sales report and give someone responsibility for its numbers and refreshes.
For example, decide whether “sales” means orders placed, invoices raised, or payments collected before creating the headline number. That decision belongs to your business. A polished chart won’t resolve it for you.
What If You Use a Mac?
Power BI Desktop is a Windows application. The online service is available through a supported browser, so Mac users can consume reports and use supported web features, but that isn’t a native Mac version of Desktop.
I see this as a meaningful disadvantage for a Mac-based authoring team. Work out which tasks require Desktop before choosing a Windows virtual environment or assuming browser authoring covers your workflow.
For a team that mainly wants to query a database and assemble browser-based dashboards, I’d also shortlist Metabase. Power BI becomes more compelling when you want its modeling tools and Microsoft fit enough to accommodate the authoring setup.
Preparing Data and Defining Your Metrics
Power Query is one of the best reasons to choose Power BI over another spreadsheet full of manual fixes. It records transformation steps, giving you a repeatable way to prepare incoming data.
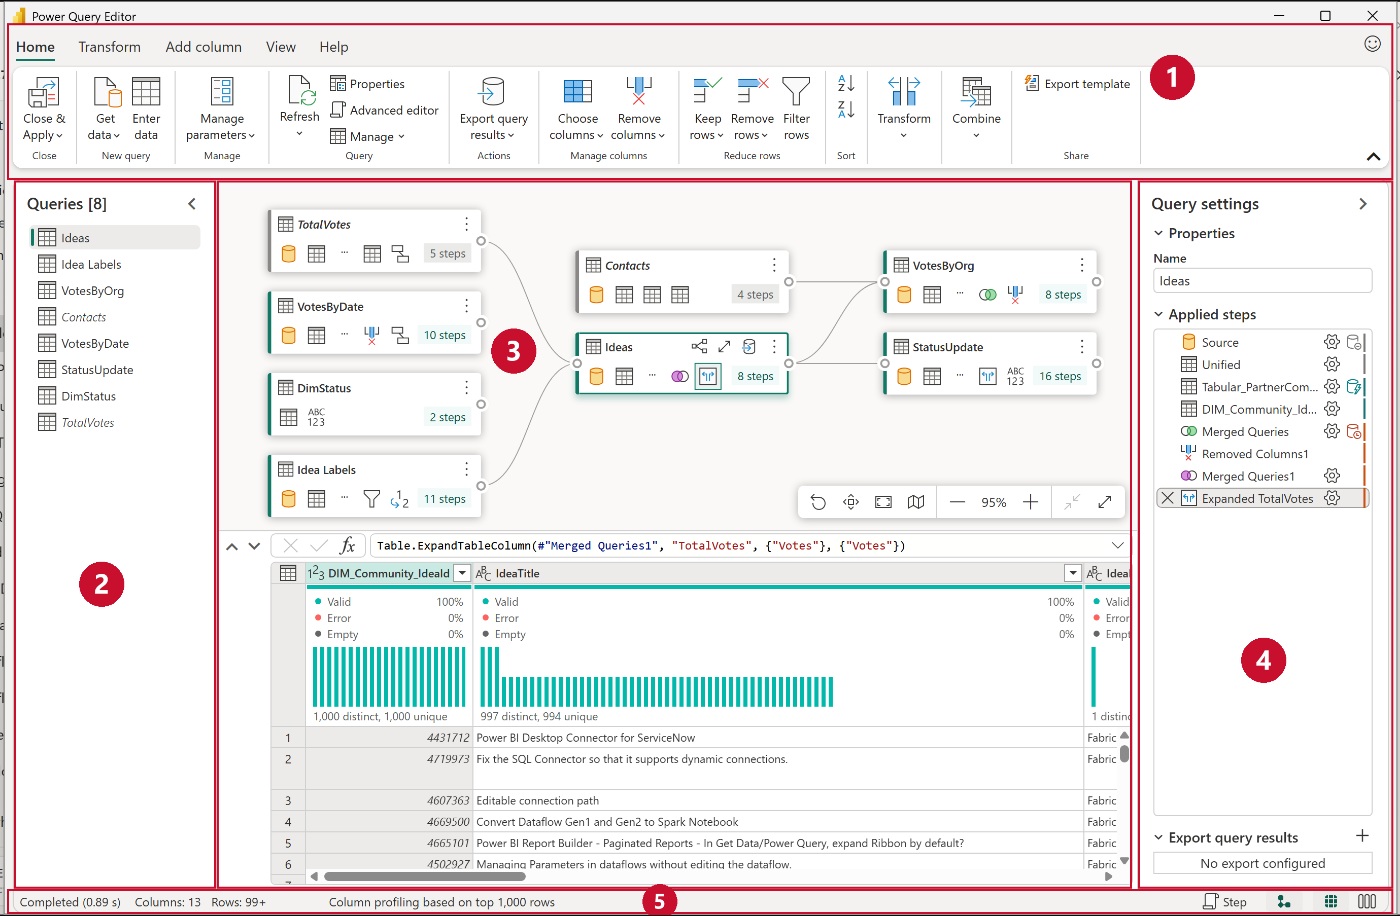
For a weekly report, this means applying the same cleanup rules to the next batch of data.
- Power Query prepares the data: use it to shape the tables before analysis.
- Relationships connect the tables: these determine how parts of your model work together.
- DAX defines calculations: measures can respond to the filters and selections in a report.
I like this separation because it gives an analyst somewhere sensible to put each piece of logic. My reservation is the learning curve. A formula that looks reasonable can still produce the wrong business answer if its filter behavior or relationships are wrong.
For example, a margin percentage needs an agreed calculation. Averaging the percentages on individual transactions can tell a different story from dividing total profit by total revenue. I’d validate that kind of measure against a small, understood dataset before putting it in front of management.
Import or DirectQuery?
Import stores a copy of the data in the model. DirectQuery queries the underlying source as people interact with reports.
I would usually evaluate Import first for routine reporting, then consider DirectQuery where freshness or data volume makes it appropriate. DirectQuery transfers more responsibility to the database and connection: slow source queries can become slow visuals, and more viewers can mean more query load.
Looker is worth comparing if your priority is a centrally managed, warehouse-based modeling approach. I prefer Power BI’s proposition when the analyst needs data preparation and report construction together.
Building Reports People Can Actually Use
Power BI’s interactive reports let readers investigate what sits behind a headline number. Select a region in one visual, for example, and related visuals can filter or highlight its results.
Drillthrough lets readers move from a summary into a detail page filtered to the selected context. I’d use that for a regional sales overview that leads into the relevant customer or product breakdown. It gives the report a purpose beyond reproducing a presentation slide.
I’d build around three priorities:
- Clear summary visuals: establish what changed before asking readers to investigate.
- Focused detail pages: use drillthrough for supporting information instead of crowding everything onto one page.
- Consistent themes: reuse colors and formatting so different reports feel related.
Power BI supports report themes, including custom themes that can be reused. I like that for a growing reporting library: you shouldn’t need to restyle each report independently.
Still, a theme won’t choose the right chart or explain a confusing measure. I’d spend more effort on labels, useful comparisons, and definitions than on decorative formatting.
Tableau belongs on the shortlist when visual exploration is the main buying priority. For a business standardizing recurring operational reports, I find Power BI’s combination of preparation, modeling, and distribution more persuasive than choosing on chart appearance alone.
Is Power BI Copilot Worth Paying For?
I wouldn’t choose Power BI solely for Copilot. It can assist with report analysis and DAX, but the value depends on having data that is already understandable and an organization willing to fund the required capacity.
Power BI Copilot needs eligible paid Fabric F2 or higher, or Premium P1 or higher capacity, plus the relevant administration and regional requirements. Pro or Premium Per User alone isn’t enough, and trial capacity does not qualify. New buyers should focus on Fabric; the older P capacities have restricted purchasing availability.
This is a different threshold from the F64 requirement for free viewers. Buying a small capacity for Copilot does not automatically solve your report-sharing bill.
What interests me more than generating a chart from a prompt is the ability to prepare a model for AI:
- An AI data schema can focus the fields available for AI analysis.
- Model instructions can explain relevant business context.
- Verified answers can supply approved visual responses to recurring questions.
Those controls make the feature more useful for a business with established definitions. They also reveal how much groundwork remains. Someone still has to decide which fields matter and whether a generated answer is correct.
My recommendation is to pilot Copilot against questions with known answers. If it cannot reliably handle the reporting questions your team repeats every week, broader access will not fix the underlying model.
Sharing Reports Without Losing Control
The online service is where Power BI becomes a team reporting system. Publishing is only the beginning; access and refresh determine whether people can rely on the result.
For imported models, the published plan limits include:
| Limit | Pro | Premium Per User |
|---|---|---|
| Model memory | 1 GB | 100 GB |
| Scheduled refreshes | Up to 8 daily | Up to 48 daily |
These are model-memory limits, not source-file sizes. Operations such as refreshing also need memory, so the upper bound is not a promise that every model of that size will run. The refresh row applies to scheduled import refreshes.
If the service cannot directly reach your data, an on-premises gateway can bridge that connection. This is useful for keeping local sources in a cloud reporting workflow, but someone must maintain the gateway and credentials.
I would make refresh ownership explicit. Power BI can disable scheduled refresh after repeated failures, so “we published it” isn’t a maintenance plan. For an important operational report, decide who checks failures and how readers recognize stale data.
Permissions Need More Than a Sharing Link
Row-level security can restrict which rows a reader sees, such as limiting a regional manager to their territory. However, it doesn’t apply to workspace Admins, Members, and Contributors in the same way as Viewers because those roles have edit permissions.
That distinction matters more to me than a broad claim that the platform is secure. Give report consumers the role they need, then check the resulting access.
Publish to web is public distribution, not a shortcut around private viewer licenses. I would reserve it for material explicitly intended for public release.
How Does Power BI Compare to Competitors?
Power BI is my first shortlist choice for a Microsoft-based reporting team, but I would look elsewhere when a different workflow matters more:
- Tableau: I’d compare it for teams prioritizing visual exploration. Its Standard Creator license costs $75 per user per month, billed annually, so authoring starts at a substantially higher seat price than Power BI Pro. The roles and bundles differ, making this a starting-price comparison rather than an identical package.
- Metabase: I’d shortlist it for browser-based database questions and dashboards. The free, self-hosted Open Source edition is appealing if you can manage the infrastructure; more advanced governance can require a paid plan.
- Looker: I’d consider it for developer-managed business definitions over a warehouse. Platform and user charges make the buying decision more involved than comparing a single per-user price.
How I Reviewed Microsoft Power BI
I assessed Power BI for a small reporting team, an organization with existing Microsoft licenses, and a business expanding access to more viewers. My recommendations weigh data preparation, report design, sharing permissions, and ongoing maintenance against subscription costs.
Prices current as of October 2026, using US list pricing.
Should You Choose Microsoft Power BI?
Yes, if you want an enterprise BI platform for repeatable reporting and are prepared to maintain its data models. I particularly recommend it for organizations already invested in Microsoft, where existing skills and license entitlements can strengthen the value.
My main hesitation is the gap between building one report and operating reporting for a company. Viewer licenses, model ownership, and refresh maintenance all become more important as the audience grows.
I’d start with a recurring report and a small group of intended readers. Check that they can access it, that its numbers match an agreed definition, and that refresh works reliably. Those results are a stronger reason to expand than the number of AI features on the purchase page.
For a Mac-first team needing simple database dashboards, I’d compare Metabase before committing.
FAQ
Is Microsoft Power BI free?
Power BI Desktop is free for creating reports. Ordinary private collaboration in the online service requires appropriate licenses or qualifying capacity. I would treat free authoring and team distribution as separate buying decisions.
Does Microsoft 365 include Power BI Pro?
Microsoft 365 E5 and Office 365 E5 include Power BI Pro. Other Microsoft 365 subscriptions should not be assumed to include it. Check your organization’s actual entitlement before purchasing additional seats.
Can I use Power BI on a Mac?
You can access the online service through a supported browser. Power BI Desktop requires Windows, so plan for a suitable Windows environment if your authoring workflow needs that application.
Does Power BI Premium Per User include Copilot?
PPU alone does not provide Power BI Copilot. Your organization also needs eligible paid capacity and must meet the relevant administration and regional requirements.
Is Power BI better than Excel?
I prefer Power BI for repeatable, shared reporting with interactive visuals and reusable measures. I’d keep Excel for ad hoc spreadsheet work where building and maintaining a reporting model would add unnecessary work. The right choice depends on what happens after the first analysis.