
Editor’s note: Our Cube review weighs pricing, metric consistency, deployment choices, and day-to-day ownership.
Quick verdict: I recommend Cube for teams that need consistent metrics across dashboards, AI assistants, and customer-facing analytics. Its shared semantic model gives those tools a common definition of your data, but someone still needs to own the modeling and maintenance.
Cube belongs on your shortlist if “revenue” means something different in every report. As a standalone semantic layer, it sits between your data sources and the tools that ask questions of them. The commercial product also includes its own analytics interface, so you can build reports without developing everything yourself.
Key Takeaways
- Best for shared metrics: Cube brings business definitions and data-access rules into a reusable model.
- Commercial Cube includes dashboards and AI chat, alongside its developer-facing capabilities.
- Open-source Cube Core gives you a self-hosted option, with portable model definitions.
- It still needs a technical owner: AI assistance doesn’t remove the need to review your business logic.
- Budget beyond user seats: Dedicated infrastructure and additional AI usage can add to your bill.
In this review, I’ll explain the costs, modeling work, and analytics features that would influence my buying decision.

Cube Pros and Cons
Pros
- Shared metric definitions can support both BI tools and AI consumers.
- Data models transfer between commercial Cube and open-source Cube Core.
- Workbooks and dashboards provide a ready-made analytics interface.
- Pre-aggregations can reduce repeated work in your source database.
- Built-in AI evaluations compare query results against reference answers.
Cons
- Model definitions and access policies need technical oversight.
- Queries that miss pre-aggregations can fall back to your source database.
- AI overage can start automatically after an individual user’s grant runs out.
- Self-hosting Core means operating and maintaining the underlying infrastructure.
How Much Does Cube Cost?
Cube’s seat price is only part of the budget. Your deployment choice and AI usage also matter, particularly when you’re moving from a small evaluation to a customer-facing application.
- Free ($0): For assessing the platform with up to five workbooks.
- Starter ($40/developer/month): For developer-led use with a higher request allowance.
- Premium ($80/developer/month): For teams needing Explorer and Viewer roles, embedded dashboards/chat, or managed dbt integration.
- Enterprise (custom pricing): For SAML SSO, BYOC, custom roles, and advanced networking.
| Plan | Daily requests | Additional seat pricing |
|---|---|---|
| Free | 1,000 | Not listed |
| Starter | 10,000 shared; 50,000 dedicated | Not listed |
| Premium | Unlimited | Explorer: $40/month; Viewer: $20/month |
| Enterprise | Unlimited | Custom |
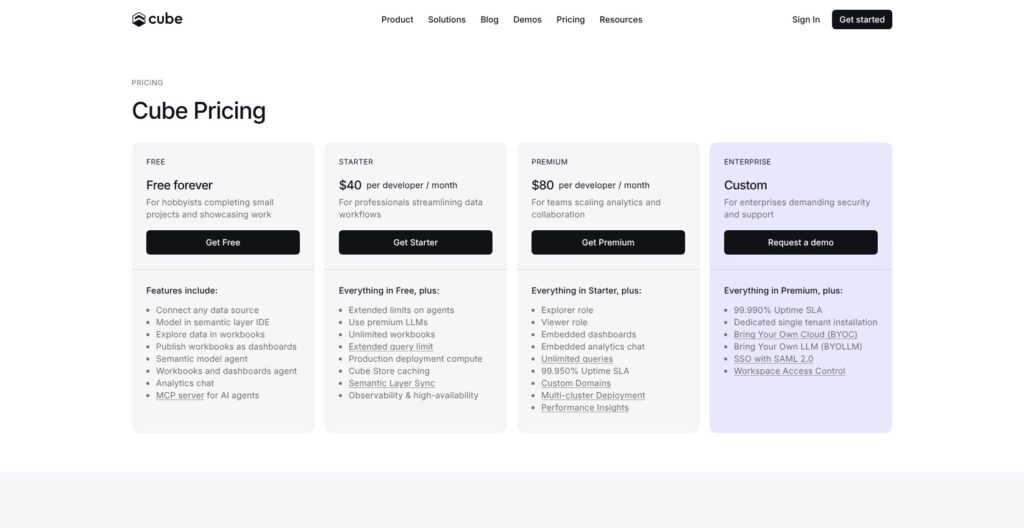
Optional dedicated deployment compute costs $0.60/hour on Starter or $1.20/hour on Premium. At 730 hours, Starter compute totals $438; adding one developer seat brings this example to $478/month, before extra workers, warehouse charges, or AI overage.
What Do You Pay for AI?
Paid on-demand seats include an AI grant worth half the seat price. Each user’s allowance is separate: It resets every billing cycle and cannot be pooled or carried forward.
That arrangement deserves attention if a few people do most of your AI analysis. An infrequent user’s unused grant won’t cover a colleague’s heavier usage. Once an individual grant runs out, paid overage starts automatically, although an administrator can set an account-wide monthly spending cap.
I would set that cap before inviting a wider team. Contract customers can purchase pooled token packages. Enterprise also supports bringing your own model, with model charges paid directly to your provider.
On-demand seats are billed monthly in advance, with prorated changes appearing on the next invoice. Contract billing is annual and upfront under the agreed terms.
Is Cube Good Value for Money?
Cube makes more financial sense when several tools need the same metrics. Maintaining one definition of customer revenue has a clearer payoff than adding a semantic layer for a single report.
For your own budget, separate:
- People: Who develops the model, creates analysis, or only consumes it?
- Infrastructure: What does the application need to stay responsive at its expected load?
- AI usage: Which people or workflows will generate most of the requests?
Reviewer’s Notes: I recommend starting with Free to assess fit. Choose Starter for a developer-led project, and Premium when the team roles or embedded experience justify the upgrade. A low seat price alone wouldn’t persuade me to move an existing analytics stack.
Getting Started With Cube
Start with a small set of agreed business metrics. Connecting every available table makes little sense if your team hasn’t decided which numbers it wants to standardize.
The commercial setup lets you connect an existing database or warehouse, or use a demo deployment. Source options include BigQuery and Snowflake, alongside operational databases such as PostgreSQL.
The initial workflow is:
- Connect your source and select the tables you want to use.
- Generate an initial model with AI assistance.
- Review the definitions and relationships, including which users should see which data.
- Develop changes in a separate branch before committing and merging them into production.
- Create a workbook, organize reports into tabs, and publish selected reports as a dashboard.
I like the separation between changing a model and publishing it. A definition change can affect far more than one chart, so giving it a review stage is sensible.
Step three deserves the most attention. Check that suggested relationships represent your business correctly and that access rules prevent one customer from seeing another’s data. I would make those checks part of the review before merging a model change.
Should You Start With Cube Core?
Cube Core suits a team that wants to build and operate its own setup. It contains the open-source semantic layer, including modeling, access control, caching, and APIs. Commercial Cube adds the broader analytics product and ready-made experiences.
I would choose the commercial route if the priority is giving colleagues an analytics interface. Core is more appealing when engineers want infrastructure control and have time to manage it. Model portability between the two is reassuring, though it doesn’t make their full feature sets interchangeable.
Defining Metrics Your Team Can Reuse
Cube’s most useful feature is a shared definition of what a number means. A revenue chart and an AI answer are much easier to compare when both use the same underlying business logic.
You can write models in YAML or JavaScript. Within a cube, you define:
- Measures: Calculations such as total revenue or order count.
- Dimensions: Attributes you use to group or filter results.
- Joins: Relationships connecting the relevant data.
- Access policies: Rules governing who can access it.
Consider a business where finance reports revenue after refunds while sales reports the original order value. Cube can encode both calculations, but your team still has to name and define them clearly. A shared model is useful only if people know which metric answers their question.
I like the opportunity to reuse those decisions across consumers. It gives your data team a place to maintain the meaning of “net revenue,” instead of correcting it independently in each dashboard or application.
How Does Cube Work With dbt?
Cube’s managed dbt pull integration starts at Premium. It imports metadata from Git or a validated manifest and generates cubes in a branch for review. It doesn’t build your underlying dbt models, so your transformation workflow still needs to run separately.
This is useful if you already have carefully maintained dbt models and want to extend them into Cube. I would still review generated definitions before exposing them to business users.
If your main requirement is managing metrics within an existing dbt workflow, dbt Semantic Layer deserves a close comparison. Cube becomes more attractive when you also want its analytics interface, caching, and embedded delivery options.
Making Dashboards Faster With Caching
Cube can serve repeated queries without making your warehouse repeat all the work. Its caching combines an in-memory result cache with pre-aggregations: smaller, prepared datasets designed to answer suitable queries.
For a dashboard showing monthly sales by region, that could mean serving a prepared regional summary instead of repeatedly calculating it from individual orders. I like this approach for predictable reporting workloads, especially when the same charts appear for many users.
The query has to match an available pre-aggregation. Requested measures and dimensions matter, as do filters, time granularity, and time zones. A monthly summary won’t automatically satisfy every more detailed question someone asks.
When there isn’t a match, Cube normally queries the source instead, unless you enable rollup-only mode. My concern is that a fast standard dashboard can give you an incomplete picture of what happens when users start exploring.
Before committing, I would assess both the regular dashboard queries and the less predictable follow-up questions. The latter are particularly relevant for conversational analytics, where people can ask for combinations you didn’t anticipate.
Fresh Data Still Takes Work
Pre-aggregations need refreshing, and refresh workers build and update them. More tenants and rollups can increase that workload enough to require additional clusters.
I would agree on a freshness requirement for each important report, then budget around it. A daily management summary and an operational screen don’t necessarily need the same refresh schedule. Caching is a useful performance tool, but it still needs configuration and ongoing ownership.
Using Cube for AI and Embedded Analytics
Analytics Chat lets you ask questions in ordinary language against the semantic model. It can work through questions requiring multiple queries and save results as reports or explorations.
That is a useful route for colleagues who know the business question but don’t know SQL. Workbooks then give them somewhere to organize analysis, while dashboards provide a more controlled view for recurring reporting.
I like this progression from a question to something shareable. If you already use Looker, though, its conversational analytics deserve a comparison before you add another platform. AI chat alone isn’t a reason to switch.
How Much Should You Trust the Answers?
Cube lets you add descriptions and agent-only context to clarify business terms and guide metric selection. This matters when a question such as “Who are our best customers?” could mean highest revenue, strongest retention, or greatest margin.
A governed model helps, but a fluent answer still deserves scrutiny. I would define those ambiguous terms before opening AI analysis to a wider audience.
Cube’s Evals feature offers a practical check: It executes an agent query and reference SQL, then compares the result sets. Questions live in versioned YAML and can run against branches, helping you assess changes before release.
The limitation is specific: Evals don’t grade the narrative explanation. Correct query results don’t establish that every sentence explaining them is correct. I consider that an important distinction for anyone planning to share AI summaries directly with customers.
Getting Analytics Into Your Product
Cube gives developers several delivery choices:
- Signed iframe embeds: Add a dashboard or Analytics Chat to an application.
- Chat API: Build a custom conversational interface.
- Core APIs: Take more control over the analytics and visualizations you create.
I would favor an iframe when the standard experience meets the need. A custom interface makes more sense when analytics must closely match the rest of your product, with the additional engineering work that implies.
Cube also has a hosted MCP server for AI clients. It uses OAuth over HTTPS and limits tool access according to the user’s role and deployment access. That makes permissions part of the integration, though your team still needs to assign the right access in the first place.
How Does Cube Compare to Competitors?
I would choose Cube for shared metric delivery across several experiences. If you have a narrower requirement, an alternative may fit your existing workflow better.
- dbt Semantic Layer: My first comparison for a team already building its metrics around dbt. MetricFlow supports metric queries and automatic joins, while definitions stay close to the transformation workflow. Choose it when that continuity matters most; consider Cube when you also want its own analytics experience and pre-aggregation system.
- Looker: Worth staying with if your organization already has a substantial LookML investment and relies on its dashboards and Explores. I would need a specific requirement that the existing setup struggles to meet before taking on a migration.
- Metabase: My shortlist choice for straightforward visual analysis. Its query builder supports selecting tables, joining data, filtering, grouping, and creating charts. If the immediate job is helping colleagues answer database questions and build dashboards, assess whether that already covers the need before adding Cube’s modeling responsibilities.
The decision I would make first is whether you need a shared semantic layer across applications or primarily a place to analyze data. Cube can support both, but its modeling investment is easier to justify when several consumers benefit from it.
How I Reviewed Cube
This review is based on independent analysis of Cube’s capabilities and costs for teams managing shared metrics, embedded analytics, and AI access. I put particular weight on model ownership, permissions, portability, and costs beyond the initial seat price.
The recommendations reflect those trade-offs. They are not performance benchmarks or an assessment of measured AI accuracy. Prices are current as of October 2026.
Should You Use Cube?
I recommend Cube when maintaining consistent metrics across multiple tools has become a real job for your data team. Its modeling, caching, and choice of analytics interfaces give you a credible way to centralize that work.
It is harder to justify for a small team that only needs a handful of internal charts. I would assess Metabase first in that situation, or keep an established Looker setup if it already serves the business well.
Start with a focused evaluation around a few important metrics and their intended consumers. If Cube’s model is useful to both your internal reporting and customer-facing application, the case for adopting it becomes much stronger.
Cube FAQ
Is Cube Core the Same as Commercial Cube?
No. Core is the open-source semantic layer. Commercial Cube adds the broader analytics platform; don’t assume every commercial feature is included in Core.
Does Cube Replace Your Warehouse or dbt?
No. Your warehouse stores and processes the underlying data, and dbt can continue running transformations. Cube adds shared definitions and governed access above them.
Do You Need to Know How to Code?
Business users can ask questions through Analytics Chat. Someone still needs the technical knowledge to review models, relationships, and permissions.
Can You Self-Host Cube?
Yes, through Cube Core. Its backend is Apache 2.0 licensed. You take responsibility for running the infrastructure.
Do Cube Seats Include Unlimited AI?
No. Paid on-demand seats have individual grants, with paid overage beyond them. Administrators can cap monthly overage spending.