Editor’s note: This Traceloop review is an independent assessment of documented workflows, configuration, pricing, and deployment options.
Quick verdict: I recommend Traceloop for engineering teams already using OpenTelemetry that want LLM tracing alongside evaluations and prompt management. My main reservations are its 24-hour free retention and quote-based paid plan, which make sustained production use a different buying decision from installing its SDK.
The distinction matters: OpenLLMetry is the free, Apache-2.0 instrumentation library. Traceloop is the platform that adds dashboards and application-management workflows around that telemetry. Choosing the library does not require choosing the platform.
Among LLM observability tools, I find Traceloop most compelling when backend flexibility matters more than a generous free investigation history. I would be less enthusiastic if the goal were simply to retain chatbot traces cheaply for several weeks.
In this review, I’ll look at Traceloop’s setup, evaluations, prompt management, and privacy controls to help you decide whether it fits your application.
Key Takeaways
- OpenLLMetry supports alternative backends, so instrumentation can remain useful outside Traceloop.
- Free Forever includes 50,000 spans monthly, but spans are not equivalent to application requests.
- Free retention is only 24 hours, making delayed incident investigations a poor fit.
- Enterprise pricing requires a quote, including custom retention and on-prem deployment.
- Prompt content is captured by default, so privacy configuration belongs before sensitive traffic.
Pros and Cons
Pros
- Apache-2.0 OpenLLMetry instrumentation.
- Alternative OpenTelemetry export destinations.
- Immutable published dataset versions.
- Prompt Registry supports version rollback.
- Enterprise offers on-prem deployment.
Cons
- Free history lasts only 24 hours.
- No published fixed Enterprise price.
- Free seat information is inconsistent.
- Integration coverage differs by language.
Traceloop Pricing
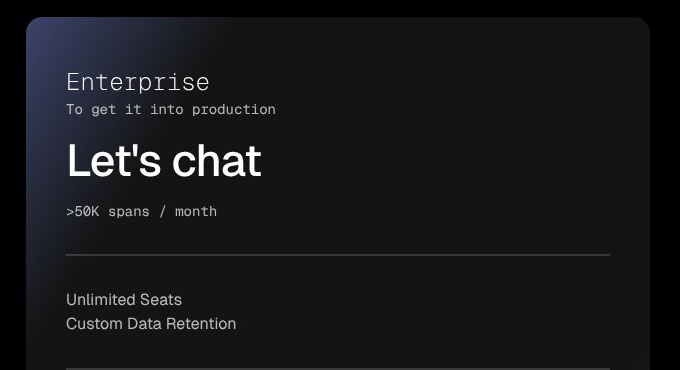
Traceloop’s public pricing has two choices: a free hosted plan and a custom-priced Enterprise plan. There is no fixed paid entry price, which is my biggest budgeting objection for a small engineering team moving beyond experimentation.
- Free Forever ($0 per month): for initial instrumentation and short-window investigations, with up to 50,000 monthly spans.
- Enterprise (custom pricing): for requirements beyond the free allowance, with custom retention and commercial deployment options.
| Plan detail | Free Forever | Enterprise |
|---|---|---|
| Monthly price | $0 | Custom quote |
| Monthly spans | Up to 50,000 | More than 50,000, scoped commercially |
| Data retention | 24 hours | Custom |
| Seats | Card lists up to 5; FAQ says unlimited | Unlimited |
| Monitoring Dashboard | Included | Included |
| Evaluation Dashboard | Included | Included |
| CI/CD integration | Included | Included |
| Prompt Management | Included | Included |
| On-prem deployment | Not listed | Included as an option |
| Dedicated Slack support | Not listed | Listed |
| SOC 2 compliance | Not listed on card | Listed on card |
The free plan’s seat information is published inconsistently: its card lists up to five seats, while the FAQ says unlimited. I would budget around the card’s smaller figure rather than treat unrestricted collaboration as settled.
The more consequential limit is retention. A monthly span allowance describes ingestion volume, not how long individual records remain available. An issue reported several days after generation falls outside the free plan’s 24-hour history, even if monthly consumption is low.
Spans also need careful interpretation. Individual LLM calls and vector database calls each count as spans within a trace. A multi-step application request can therefore consume several spans.
For a hypothetical five-span request, including any parent spans, the 50,000-span allowance would cover 10,000 requests. Your application’s call structure determines how far the allowance actually goes; this example is not a measured workload.
Feature inclusion does not settle every cost question, either. The plan cards do not establish monitor quotas, evaluator-model charges, or a support response SLA. I would want an Enterprise quote to separate those items from ingestion and retention rather than hide them behind a single platform label.
Is Traceloop Good Value for Money?
- For a staging workflow, yes. Free access includes evaluation and prompt-management features alongside monitoring, rather than limiting the starting point to trace collection.
- For ongoing free investigations, less so. Langfuse’s free Hobby plan provides 30 days of data access, compared with Traceloop’s single day.
- For private deployment, value is quote-dependent. The relevant comparison includes infrastructure operations and support, not merely hosted ingestion.
I recommend Free Forever for an engineer instrumenting one non-sensitive staging workflow. Enterprise makes sense only when its quote fits the actual span volume, required history, deployment arrangement, and support needs.
Getting Started With Traceloop
The first decision is what to capture, not which decorator to add. I would begin with a non-sensitive staging workflow so that instrumentation choices do not accidentally become a production data policy.
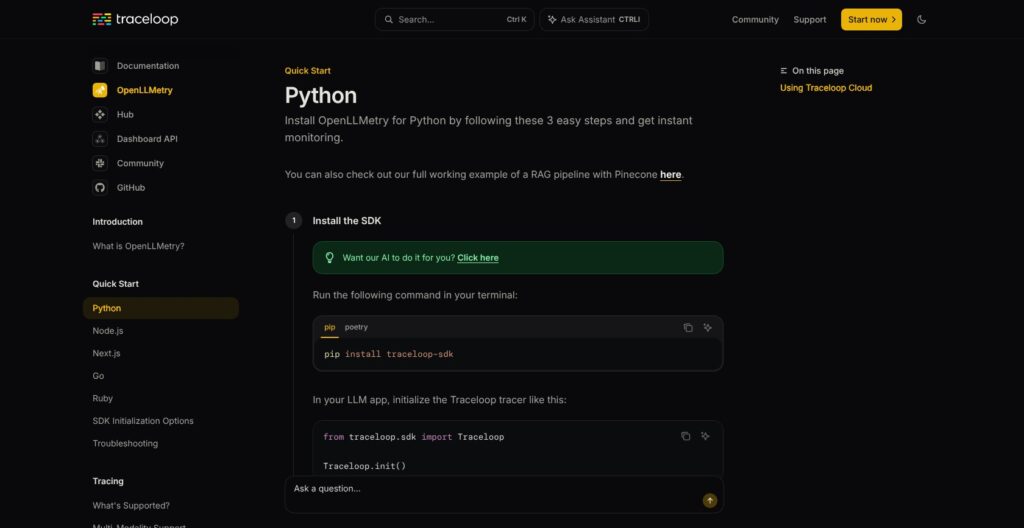
The documented Python setup follows a concrete sequence:
- Create the project and environment. Generate an API key under Settings > Organization. Keys are scoped to a particular project and environment, and the key must be copied immediately.
- Set the credentials and capture policy. Configure
TRACELOOP_API_KEY. SetTRACELOOP_TRACE_CONTENT=falseif prompts, completions, and embeddings should not be recorded in span attributes. - Install and initialize the SDK. Install the
traceloop-sdkpackage and initialize it withTraceloop.init()in application code. - Define the application structure. Use supported automatic instrumentation, then annotate custom workflows and tasks where application-specific boundaries matter.
- Run the application and inspect its traces. Use the matching project and environment. For local development,
disable_batch=Truemakes export immediate rather than batched.
For an illustrative retrieval-augmented generation application, I would make the answer-generation function the workflow and identify retrieval as a separate task. Supported model and vector database integrations supply their own instrumentation. The custom annotations explain how those calls fit the application’s logic.
The Python workflow decorator supports both synchronous and asynchronous functions. That removes the need to adopt the deprecated aworkflow decorator just because an application uses async execution.
Next, I would add context deliberately. Association properties accept string key/value pairs, such as an organization identifier, while a consistent conversation ID groups related traces into a session. The application must propagate those identifiers; installing an SDK does not establish that relationship automatically.
Language support deserves attention before committing. Python and TypeScript SDKs are marked available; the Go and Ruby SDKs and the separate Hub proxy are marked beta. Coverage differs by language: CrewAI and OpenAI Agents, for example, are listed for Python but not TypeScript.
For JavaScript applications, import order and bundling can complicate automatic instrumentation. Traceloop’s troubleshooting guidance covers importing it before LLM libraries and explicitly supplying instrumentModules where needed, including some Next.js and Webpack situations.
Reviewer’s Notes: I would scope the first integration around one understandable workflow, not every service. A trace with meaningful boundaries and intentional identifiers is a better starting point than a larger collection of disconnected calls.
Tracing and OpenTelemetry: The Main Reason I Would Choose Traceloop
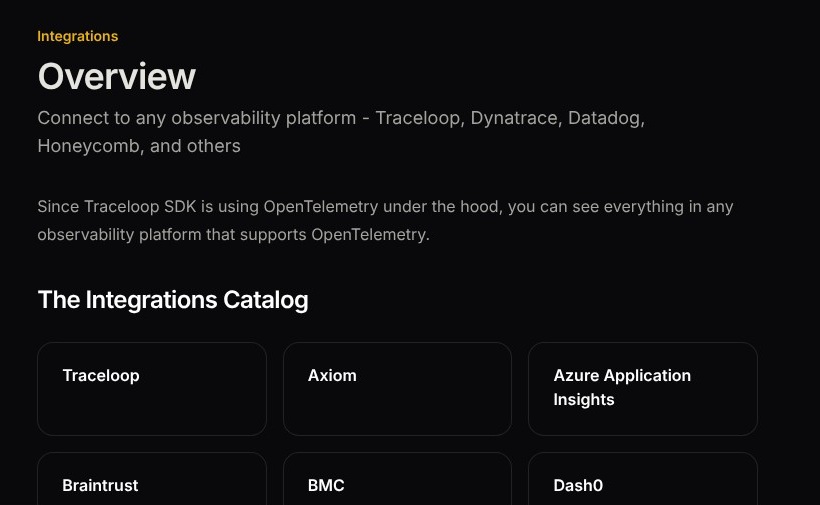
Backend choice is the strongest argument for OpenLLMetry. It builds on OpenTelemetry and supports an alternative OTLP endpoint or custom exporter, rather than making the Traceloop dashboard the only destination.
Documented integration destinations include:
- Existing observability systems: Datadog, Honeycomb, Grafana Tempo, and New Relic.
- LLM-focused platforms: Traceloop, Langfuse, and LangSmith.
- Telemetry routing: OpenTelemetry Collector.
That flexibility matters if application telemetry already follows an established path. I would rather add LLM-specific instrumentation to that architecture than create a separate collection strategy without a clear reason.
A trace represents the connected execution; spans represent its constituent operations. In a hypothetical support bot, a trace might connect retrieval with the subsequent model call. This structure gives an investigation a way to distinguish a retrieval problem from a generation problem, although it does not diagnose either automatically.
Automatic instrumentation detects supported models and frameworks by default. Explicit allow/block configuration provides more control, while decorators add custom workflow and task boundaries. I see those as complementary mechanisms: library coverage captures calls, but application annotations explain intent.
Association properties extend that context into cost analysis. The costs API can group costs by a property and filter by environment and time. I would use a consistent organization identifier for allocation, while recognizing that missing identifiers leave an incomplete picture rather than magically assigning every expense.
Feedback requires similar intentional wiring. SDK feedback calls target an Annotation Task with defined tags, and the entity must match its association property. A thumbs-up button is not automatically connected just because tracing exists.
The portability benefit applies to telemetry. Exporting spans elsewhere does not automatically move prompt versions, datasets, evaluators, or monitors. Langfuse and LangSmith also support OpenTelemetry workflows, so standards compatibility is a practical strength here, not an exclusive Traceloop capability.
Evaluations and Monitoring: Turn Traces Into Quality Checks
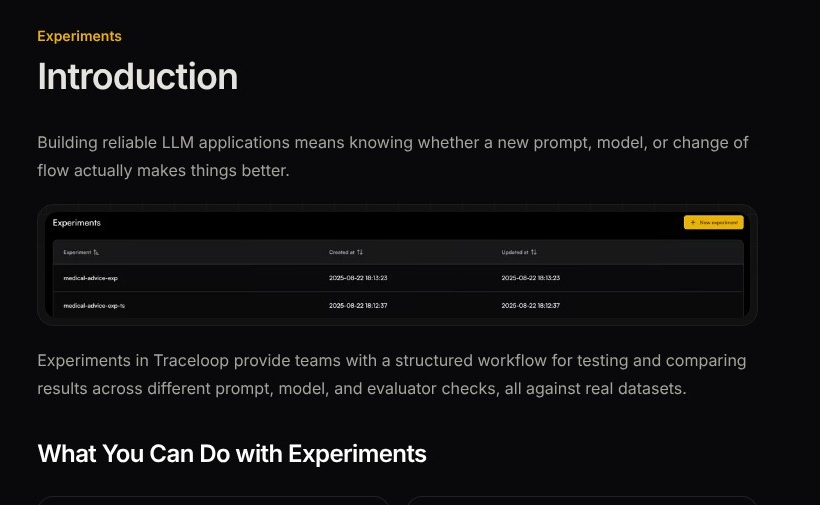
Traceloop connects production spans with evaluation workflows, but recording an answer and judging it are separate jobs. I like the available progression from examples to experiments; I would not mistake the presence of evaluator scores for proof of application quality.
Playgrounds organize inputs, prompts, and evaluators into table columns. Data can come from production spans or imported files, and execution can target an individual cell or the whole table. That allows a narrow investigation before a broader comparison.
Prompt columns support model configuration, mapped variables, and structured-output schemas where the model supports them. I like that distinction: setting up a schema gives the experiment an expected output shape, but it does not make every model support structured output.
My preferred regression workflow would be:
- Choose representative examples. Include expected successes and known failure cases rather than only convenient prompts.
- Configure the checks. Use built-in evaluators or a custom evaluator with appropriate model settings and prompt criteria.
- Publish a dataset version. Published versions are immutable snapshots, providing a stable input set.
- Run an SDK experiment. Supply the published dataset version, task function, and evaluator identifiers.
- Compare outputs and assessments. Inspect changed answers as well as scores across runs.
For a hypothetical RAG application, faithfulness and answer-relevancy evaluators could assess different aspects of an answer. Neither replaces a careful look at whether the retrieved context actually supports the expected response.
Built-in checks also include JSON and regex validation, alongside PII, secrets, and agent-behavior checks. These are different kinds of evaluation, not interchangeable measures of correctness. I would calibrate judgment-based checks against labeled examples before using their results as release criteria.
Production monitors run evaluators on spans matching a configured group or filter. Results include completed and error-run counts, with links back to matched spans. Monitors are post-hoc: they do not stop an answer before it reaches a user.
Synchronous guardrails are a separate inline integration. They change the application’s execution path, so I would treat evaluator behavior and failure handling as application design decisions, not dashboard settings.
CI/CD integration appears on both plan cards, but that entitlement alone does not establish automatic release blocking. LangSmith’s documented human-review and pairwise-comparison options also merit attention if the main priority is organizing evaluation decisions rather than telemetry routing.
Prompt Management: Useful, With Some Platform Ties
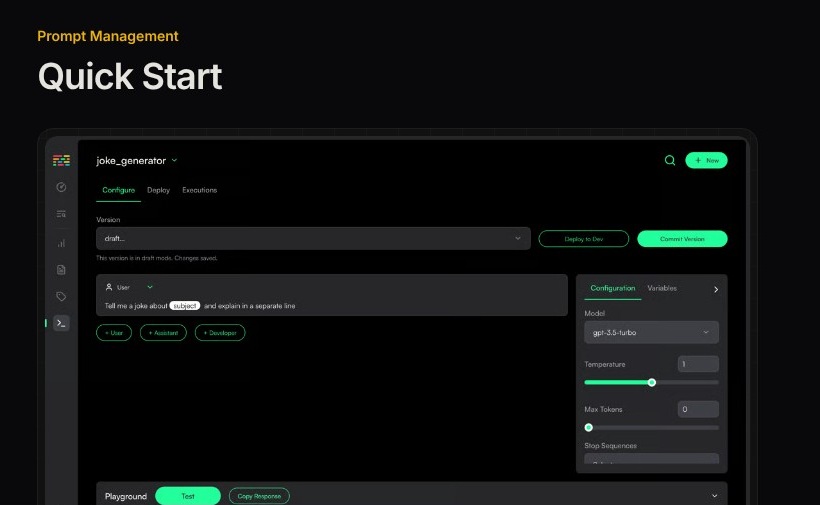
The Prompt Registry lets prompt changes follow a lifecycle separate from editing application code. I find that useful, provided the team accepts that prompt operations become platform-dependent.
The registry supports Jinja-style variables and testing in a prompt playground. Application code retrieves prompts through get_prompt, with Traceloop Sync enabled. Sync is disabled by default, so ordinary tracing initialization is not enough to activate this workflow.
The version lifecycle has meaningful constraints:
- Drafts deploy to development for iteration.
- Published versions are immutable and move through development, staging, and production.
- Previous versions support rollback, while changing variable names or adding or removing variables requires a new prompt.
I like the separation between a draft and a published version because it makes the intended promotion path explicit. Still, rollback availability is not a guarantee that a prompt is compatible with the application’s current variable contract.
Synchronization also has its own cadence. The SDK polls every 60 seconds by default, or every five seconds in development, and both intervals are configurable. I would not describe that as guaranteed instantaneous deployment.
For a proposed wording change, my preference would be to compare the old and new configurations against the same published dataset before promotion. The registry controls which prompt is served; the experiment supplies evidence for deciding whether the change is worthwhile.
The migration tradeoff remains. Moving telemetry exporters does not recreate registry keys or environment assignments elsewhere. I would adopt prompt management for its lifecycle controls, not because OpenTelemetry makes this layer portable.
Privacy and Deployment: Decide What Leaves Your Application
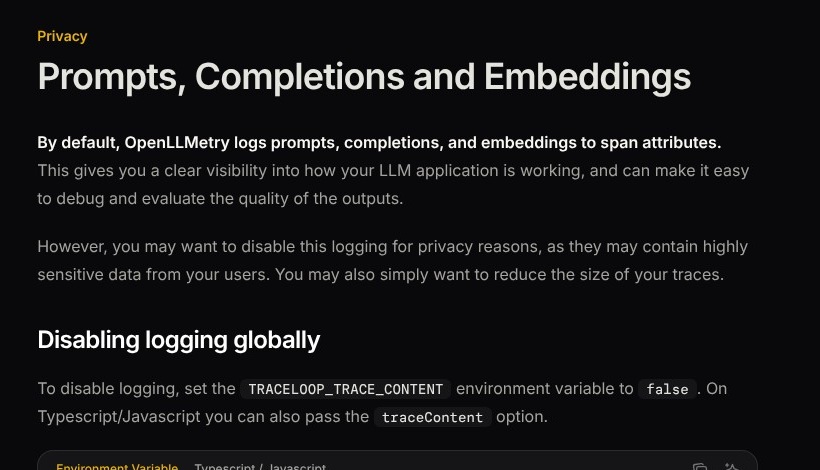
OpenLLMetry records prompts, completions, and embeddings in span attributes by default. That makes capture configuration a first-run decision, especially when an application handles customer conversations or internal documents.
Setting TRACELOOP_TRACE_CONTENT=false disables that content logging. Selective controls can enable it for particular workflows, tasks, or users identified through association properties. The documented context override also needs to be disabled afterward.
This is not automatic anonymization. Custom attributes and association identifiers may still contain sensitive information, and changing a setting does not establish that previously captured data disappears.
Private deployment requires another distinction: storage location is not processing location. Traceloop’s hybrid arrangement keeps storage in customer infrastructure while Traceloop manages processing and the dashboard, together with metadata and monitoring models. I would not summarize that as everything staying inside the customer’s network.
Full deployment is a commercial infrastructure undertaking. Its guide specifies:
- Kubernetes for deployment.
- ClickHouse and PostgreSQL as database components.
- Kafka and S3 object storage as additional infrastructure.
- Traceloop-provided image credentials and Helm setup for installation.
I regard that as materially different from installing the free OpenLLMetry library. Enterprise lists on-prem deployment and SOC 2 compliance, but those listings are not a blanket privacy guarantee or proof that any particular customer deployment satisfies its obligations.
ServiceNow’s May 5, 2026 announcement described its acquisition of Traceloop as recently completed. That establishes ownership context, not a standalone product roadmap or a promise about future commercial terms.
My recommendation is to choose the capture policy and deployment boundary together. Keeping a database private does not, by itself, answer where content is processed.
How Does Traceloop Compare to Competitors?
I would shortlist Traceloop alternatives by the requirement that creates friction, rather than rank their headline ingestion allowances. Their billing units are not directly equivalent.
- Langfuse: longer hosted history. Hobby provides 30 days of data access; Core extends that to 90 days. I would favor it when affordable investigation history matters more than Traceloop’s particular workflow. Its self-hosted core is another option, but operating the web and worker services plus storage components remains an engineering responsibility.
- LangSmith: evaluation-centered workflows. Its documented evaluation options include human review and pairwise comparisons, alongside online evaluators. I would shortlist it for dataset-driven teams, including those building with LangGraph, without treating it as restricted to LangChain applications.
- Phoenix: a free self-hosted platform. Phoenix combines tracing with evaluations, datasets, experiments, and prompt management. I would consider it when running the platform internally is the priority, while accounting for infrastructure ownership and its Elastic License 2.0 restrictions on hosted or managed-service offerings.
| Alternative | Published entry pricing | Included billing allowance | History or deployment distinction |
|---|---|---|---|
| Langfuse Hobby | Free | 50,000 units/month | 30 days of data access; 2 users |
| Langfuse Core | $29/month | 100,000 units/month | 90 days of data access; unlimited users |
| LangSmith Developer | One free seat | 5,000 base traces/month | Base traces retain 14 days |
| LangSmith Plus | $39/seat/month | 10,000 base traces/month | Additional usage is pay-as-you-go |
| Phoenix self-hosted | Free software deployment | Hosted billing allowance not applicable | Customer-operated; ELv2 license |
A LangSmith trace represents an application execution that can contain multiple steps, whereas Traceloop counts individual spans. Langfuse units should not be assumed equivalent to either. I would compare a representative workload and required retention, not divide subscription prices by superficially similar allowance numbers.
How I Reviewed Traceloop
I assessed Traceloop’s documented workflows, pricing, SDK configuration, and deployment architecture, then compared relevant primary-source specifications for the alternatives. My judgments focus on who should buy it and the implementation work involved.
This was not a hands-on application test or performance benchmark. I have not assigned measured setup times, evaluator accuracy, or a numerical product score. Documentation establishes available controls and workflows, not their production reliability or the quality of generated answers.
Prices and plan details are current as of October 2026.
Should You Use Traceloop?
I recommend Traceloop for engineering teams already using OpenTelemetry that want LLM instrumentation plus a platform for evaluations and prompt operations. Its exporter flexibility is the clearest reason to put it on a shortlist.
I would start with one non-sensitive staging workflow on Free Forever. For production, the Enterprise quote needs to justify the required retention, span volume, deployment boundary, and support arrangement.
I would choose Langfuse instead if the immediate goal is sustained, low-cost hosted history. Traceloop’s single-day free window is a real constraint, not a minor footnote. OpenLLMetry can still be useful even when the Traceloop platform is not the right purchase.
Traceloop FAQ
Is Traceloop free?
The hosted Free Forever plan costs $0 and includes up to 50,000 monthly spans with 24-hour retention. The complete platform’s on-prem deployment option belongs to Enterprise, not the free SDK license.
What is the difference between OpenLLMetry and Traceloop?
OpenLLMetry is free Apache-2.0 instrumentation built on OpenTelemetry. Traceloop is the platform offering dashboards, evaluations, and prompt-management workflows. Installing the library does not deploy the complete platform.
Can OpenLLMetry send traces to another backend?
Yes. It supports alternative OTLP endpoints and custom exporters, with documented integrations including Langfuse and LangSmith. That telemetry flexibility does not automatically migrate platform datasets, prompts, or evaluators.
Does Traceloop require LangChain?
No. Supported instrumentation includes direct model-provider integrations, such as OpenAI and Anthropic, alongside framework integrations. Coverage varies by language, so a supported Python integration should not automatically be assumed available in TypeScript.